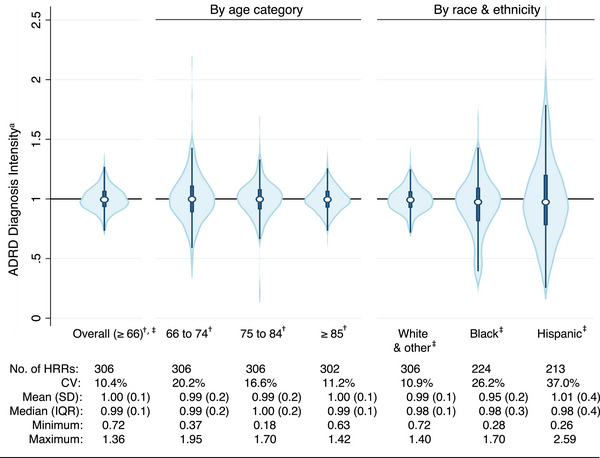
FIGURE 4.

Variation in ADRD diagnosis intensity across U.S. hospital referral regions among older adults (≥66) in FFS Medicare by age category and race/ethnicity. Note: Fewer than 306 HRRs among subgroups due to exclusion of those with fewer than 100 FFS beneficiaries. ADRD, Alzheimer's disease and other related dementias; CV, coefficient of variation; FFS, Fee‐For‐Service; HRR, hospital referral region; IQR, interquartile range; SD, standard deviation. * Defined as the ratio of observed to expected ratio of new ADRD cases, all analyses adjusted for population size, sex composition, level of education (percent < high school education), population heath (percent obese, diabetes, and smokers), and general diagnosis intensity. † Further adjusted for race and ethnicity. ‡ Further adjusted for population age (percent ≥80 years old).
