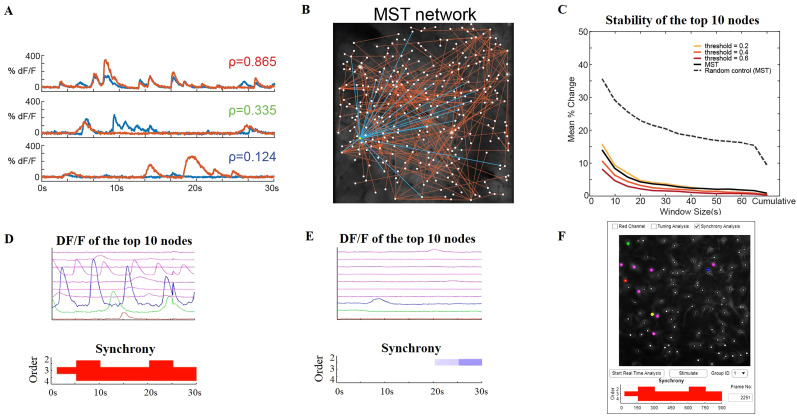
Figure 5.
Multi-timescale downstream analysis of correlations and synchrony. A, Calcium traces from three example neuronal pairs with high, moderate, and low pairwise correlations (top, middle, and bottom plots, respectively). B, The functional network constructed from the minimum spanning tree (MST) technique shown in the imaging FOV. The functional connections to the highest degree neuron are highlighted in blue. The functional network is updated every second within the real-time analysis workflow. C, Stability of cell ranking within the functional network depending on the size of the analysis window. The percentage change between two adjacent frames (averaged over all the frames) of the top 10 ranks is shown for each functional network type. Random control was computed on 10 surrogate datasets of random signals. D, Dynamic analysis of higher-order coordination (synchrony) of neuronal spiking activity using NeuroART (for details, see Mukherjee and Babadi, 2021). Example calcium traces that demonstrate significant second-, third-, and fourth-order synchrony (only the calcium traces of the top 10 ranked cells are shown here). Figures are updated every 30 s, and a significant presence of synchrony is indicated by red color. E, Example calcium traces that demonstrate significant suppression of second-order synchrony (only the calcium traces of the top 10 ranked cells are shown here). Figures are updated every 30 s, and a significant level of suppression of synchrony is indicated by blue color. In this example, there are only a few active cells, and therefore there is no coordinated neural spiking activity. F, The NeuroART GUI readout for synchrony analysis. This output is displayed below the image of the augmented FOV and the user can select between different types of downstream analyses which include synchrony analysis. The top 10 ranked neurons are highlighted in the augmented FOV image where red, green, and blue represent the first, second, and third ranked neurons.

