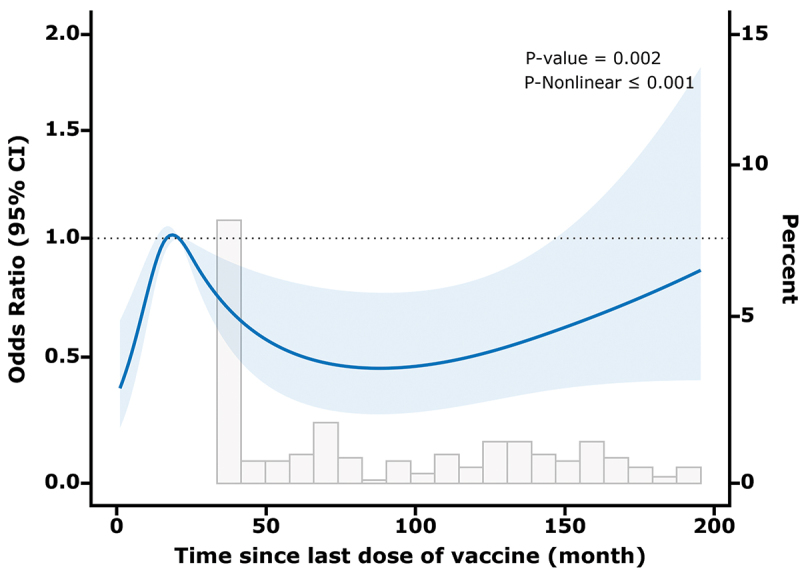
Figure 2.

Association between duration after a single dose of the varicella vaccine and IgG antibody concentrations (≥50 mIU/mL) with the RCS function. A Model with 4 knots located at 5th, 35th, 65th, and 90th percentiles. Y-axis represents the or to present IgG antibody concentrations (≥50 mIU/mL) for any value of duration after immunization compared to individuals.
