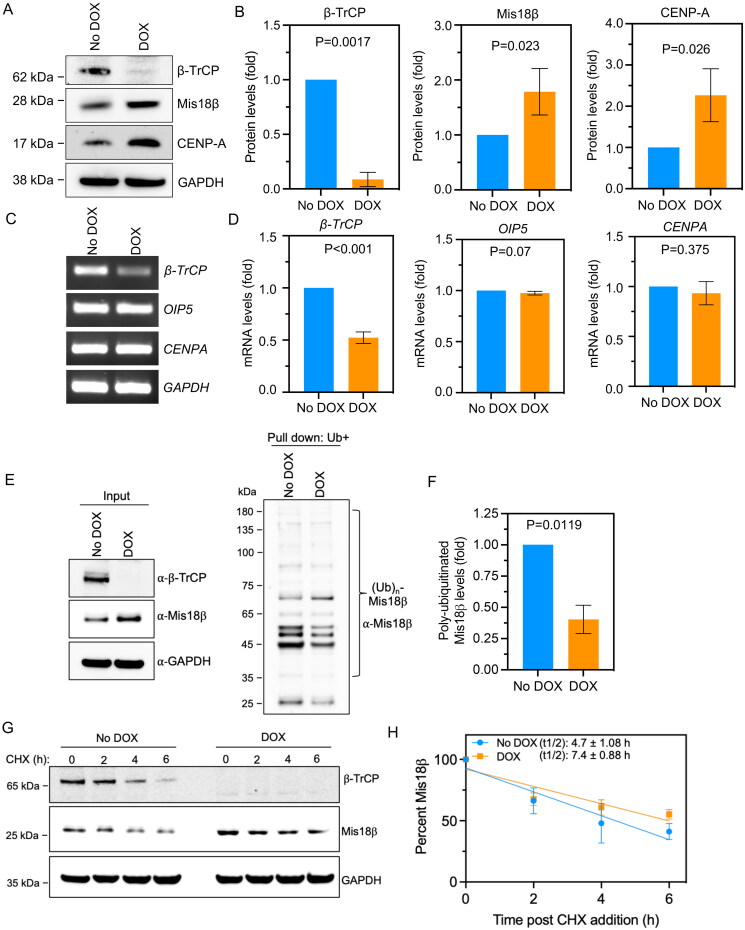
Figure 1.
Protein levels but not the transcript levels of Mis18β are increased in β-TrCP depleted cells. (A and B) Western blots (A) and bar graphs (B) showing the protein levels of β-TrCP, Mis18β and CENP-A in MDA-MB-231Δ β-TrCP cells untreated or treated with DOX for 48 h. The protein levels of Mis18β and CENP-A in B were calculated after normalization with GAPDH that was used as a loading control and expressed as fold increase relative to No DOX control. (C and D) Gel images from semi-quantitative RT-PCR (C) and bar charts from RT-qPCR (D) showing the mRNA levels of β-TrCP, OIP5 (Mis18β) and CENPA in MDA-MB-231Δ β-TrCP cells untreated or treated with DOX for 48 h. The quantification in D was after the normalization with GAPDH that was used as an internal control and expressed as log2-fold difference. (E and F) Ubiquitin pulldown assay (E) showing the polyubiquitination of Mis18β in MDA-MB-231Δ β-TrCP cells with or without DOX treatment and bar chart (F) depicting the polyubiquitinated Mis18β levels normalized against input Mis18β levels. (G and H) Protein stability assay using cycloheximide (CHX) depicting the stability of Mis18β in both DOX treated as well as untreated cells until 6 h and quantification plot (H) showing the percent Mis18β remaining in similar conditions. The half-life of Mis18β in both the conditions was calculated using GraphPad Prism. Error bars depict standard deviation (SD) from three biological repeats and the P-values were calculated using Student’s t test in B, D, F and H.

