Figure 3.
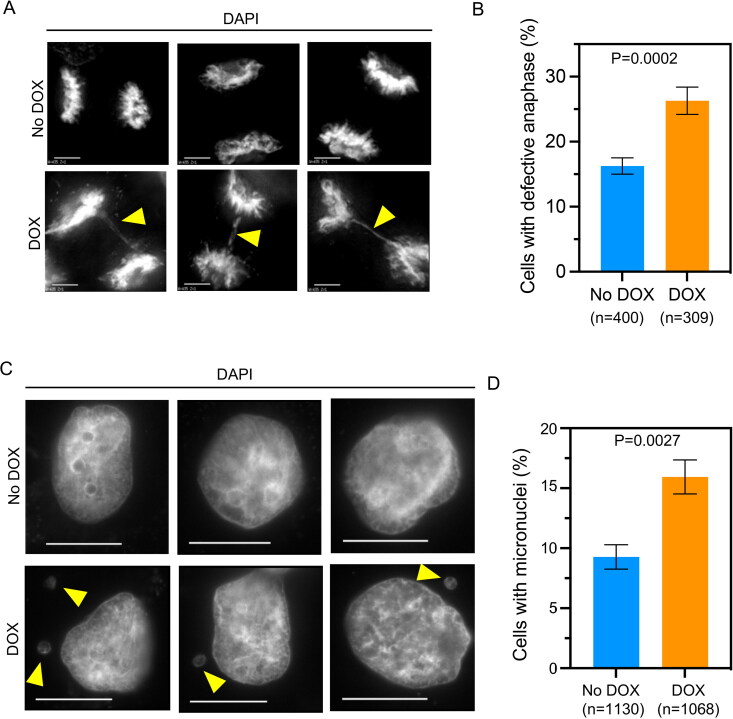
β-TrCP depletion contributes to chromosomal instability (CIN). (A) Representative DAPI stained images showing chromosome segregation status in MDA-MB-231Δ β-TrCP cells untreated or treated with DOX for 48 h. Scale bar: 5 µm. The yellow arrowhead show lagging chromosomes and DNA bridges. (B) The bar graph depicting percent of cells with defective anaphase in MDA-MB-231Δ β-TrCP cells treated as in A. (C) Representative DAPI stained images showing incidence of micronuclei in interphase as shown by yellow arrowheads in MDA-MB-231Δ β-TrCP cells untreated or treated with DOX. Scale bar: 15 µm. (D) The bar graph depicting percent of cells with micronuclei in MDA-MB-231Δβ-TrCP cells treated as in C. Error bars depict the SD across four and three biological repeats for graphs B and D, respectively. The P-values were calculated using Student’s t test in B and D.

