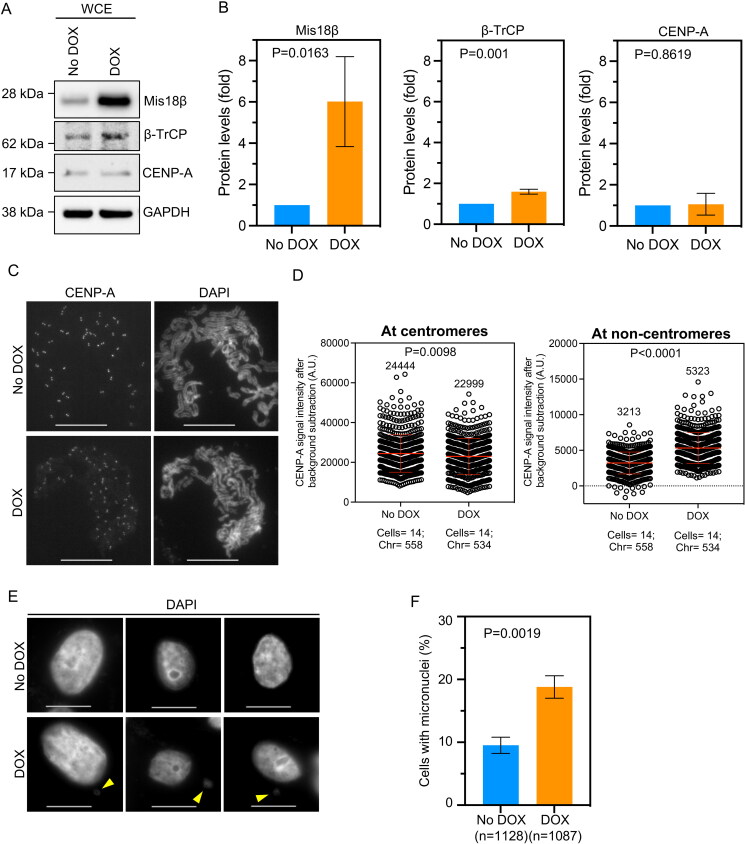
Figure 5.
Overexpression of Mis18β alone contributes to CENP-A mislocalization in MDA-MB-231 cells. (A and B) Western blots (A) and bar graphs (B) showing the levels of proteins as indicated in MDA-MB-231DOX-Mis18β cells treated or untreated with DOX for 48 h to overexpress Mis18β. The protein levels in B were calculated after normalization with GAPDH that was used as a loading control and expressed as fold increase relative to No DOX control. (C) Representative images of metaphase chromosome spreads prepared from MDA-MB-231DOX-Mis18β cells untreated or treated with DOX for 48 h, showing the localization of endogenous CENP-A on mitotic chromosomes. Scale bar: 15 µm. (D) Quantification of CENP-A signal intensities (arbitrary units) at centromeric (left) and non-centromeric (right) regions in metaphase chromosome spreads of MDA-MB-231DOX-Mis18β cells treated as in C. Each circle represents one spot quantified on chromosome. “Chr” represents number of chromosomes analyzed in the number of cells denoted. Error bars depict the SD across areas measured in the number of cells from three biological repeats. (E) Representative DAPI stained images showing incidence of micronuclei in interphase as shown by yellow arrow in MDA-MB-231DOX-Mis18β cells untreated or treated with DOX. Scale bar: 15 µm. (F) The bar graph depicting percent of cells with micronuclei in MDA-MB-231DOX-Mis18β cells treated as in E. Error bars depict the SD across three biological repeats and the P-values were calculated using Student’s t test in B, D and F.

