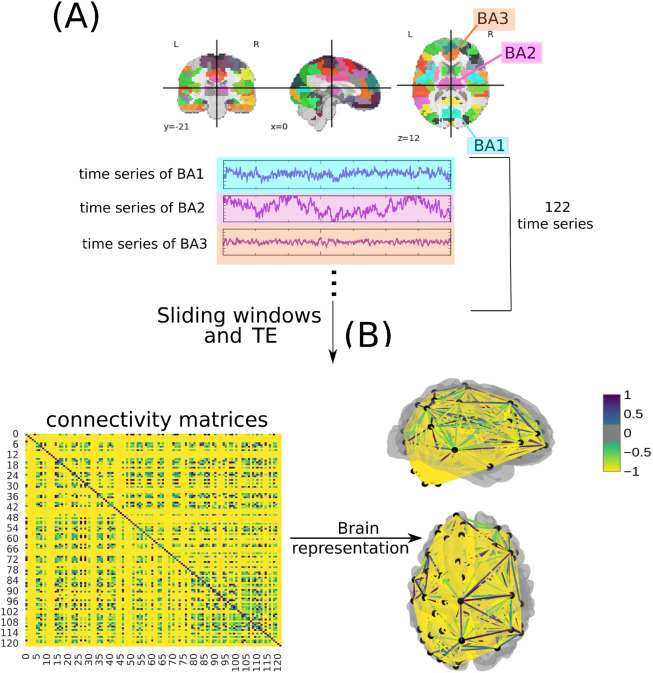
Fig 1. Methodology to obtain the connectivity matrices based on [34].
In (A), a time series of 122 ROI is extracted from fMRI data using the BASC BOLD atlas (highlighted in blue, purple, and orange). A sliding window was performed as a data augmentation. Then, they are correlated (B) to form the connectivity matrices, where each row and column corresponds to one of the Brodmann areas for a patient with ASD, TD, and ADHD (the figure illustrates an example of a connectivity matrix with a normalized TE of a subject presenting ADHD). The same highlighted matrices represent the brain in a three-dimensional (in a top and left perspective) schematic.

