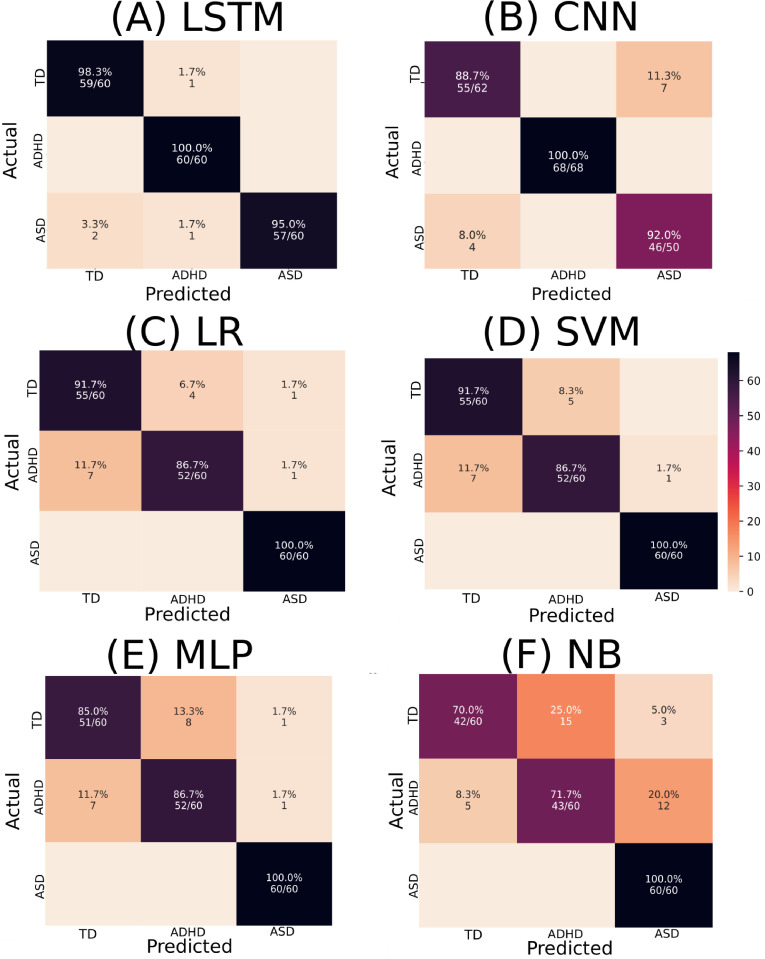
Fig 2. Confusion matrices depict the performance of various ML algorithms.
The elements in the figure labeled A to F correspond to LSTM, CNN, LR, SVM, MLP, and NB, respectively. The diagonal elements represent TP values, showcasing each algorithm’s accuracy in correctly identifying positive instances. This is noteworthy on a test sample containing 180 instances.

