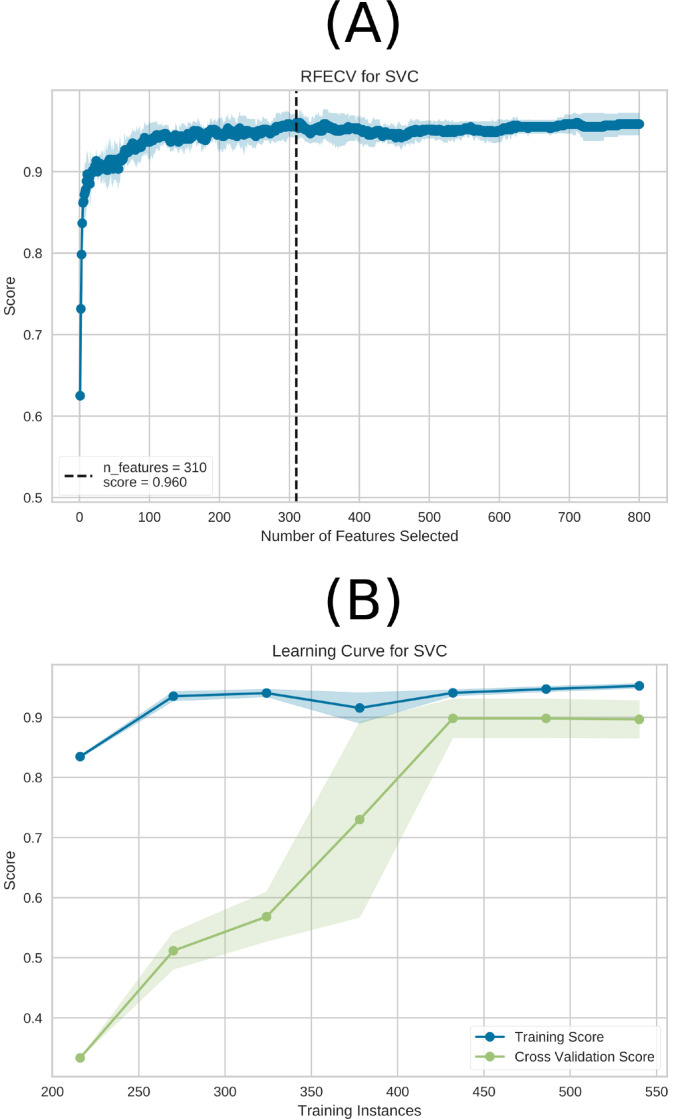
Fig 5. RFE and the learning curve for the SVM model are depicted in (A) and (B), respectively.
The best performance is achieved with a total of 310 characteristics, as shown by (A). In (B), the learning curve is presented for the training Accuracy (blue) and test Accuracy (green) using the entire dataset (600 connectivity matrices subjects). The highest performance was achieved with 450 connectivity matrices subjects without requiring the entire dataset. Notably, the connectivity matrices were generated using the data augmentation technique sliding window, and 600 connectivity matrices were used in total in the ML approach before the sampling technique.

