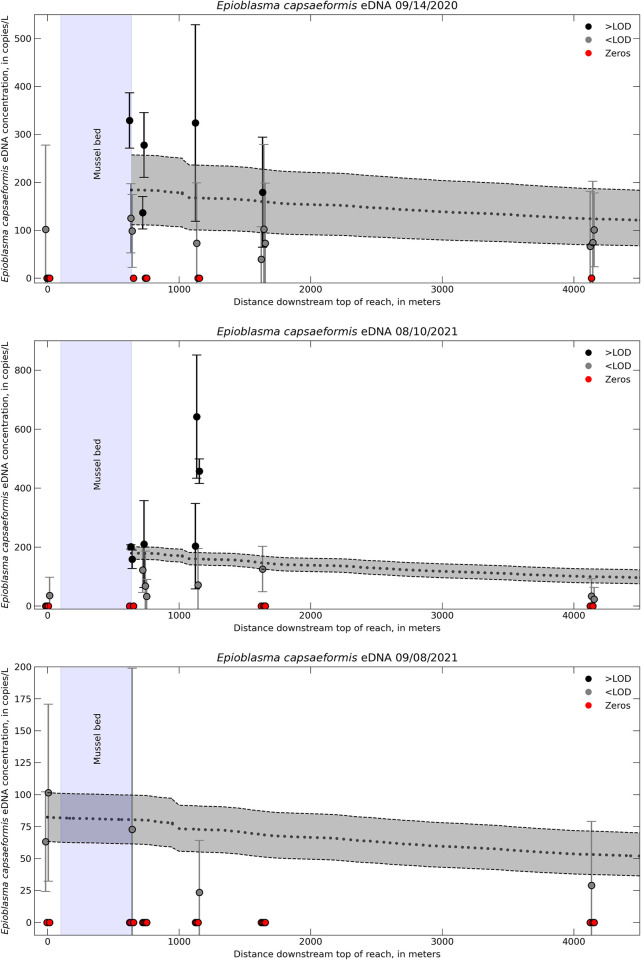
Fig 5. Environmental DNA transport model for the Wallens Bend reach.
One-dimensional transport model eDNA concentrations (dotted black line) compared to field sampled eDNA concentration for Epioblasma capsaeformis in the Wallens Bend reach in the Clinch River, TN. Different colors indicate samples either above or below the limit of detection (LOD). Error bars on the field samples represent ± 1 standard error (SE). Error associated with the model includes ± 1 SE of the initial eDNA concentration and the decay rate, which is represented by the gray shaded region.

