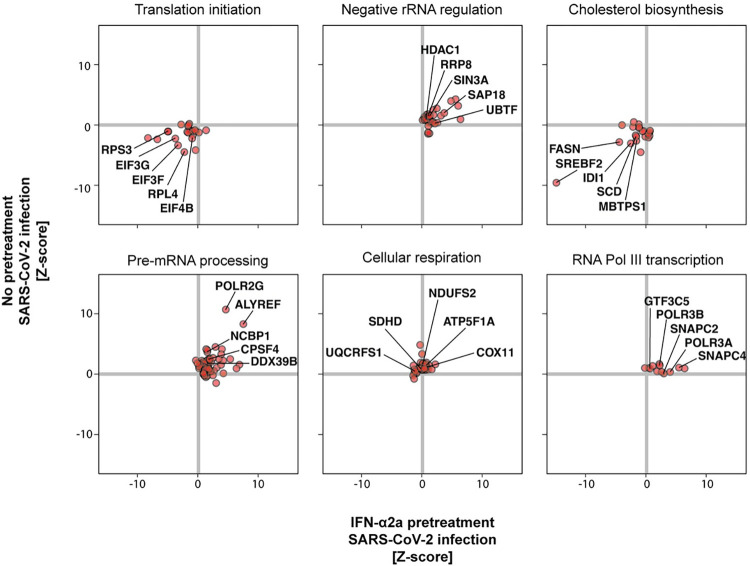
Fig 2. Cellular pathways influencing SARS-CoV-2 infection.
GSEA was performed on the screen data (S10 Table). The individual genes for some of the top pathways are shown here. The full names of the plotted pathways are as follows: translation initiation, “REACTOME EUKARYOTIC TRANSLATION INITIATION”; negative rRNA regulation, “REACTOME NEGATIVE EPIGENETIC REGULATION OF RRNA EXPRESSION”; cholesterol biosynthesis, “REACTOME REGULATION OF CHOLESTEROL BIOSYNTHESIS BY SREBP SREBF”; pre-mRNA processing, “REACTOME PROCESSING OF CAPPED INTRON CONTAINING PRE MRNA”; cellular respiration, “WP ELECTRON TRANSPORT CHAIN OXPHOS SYSTEM IN MITOCHONDRIA”; RNA Pol III transcription, “REACTOME RNA POLYMERASE III TRANSCRIPTION INITIATION FROM TYPE 3 PROMOTER.” Pathways are from the Reactome [189] and Wikipathways [191] databases. The data underlying this Figure can be found in S1 Table.

