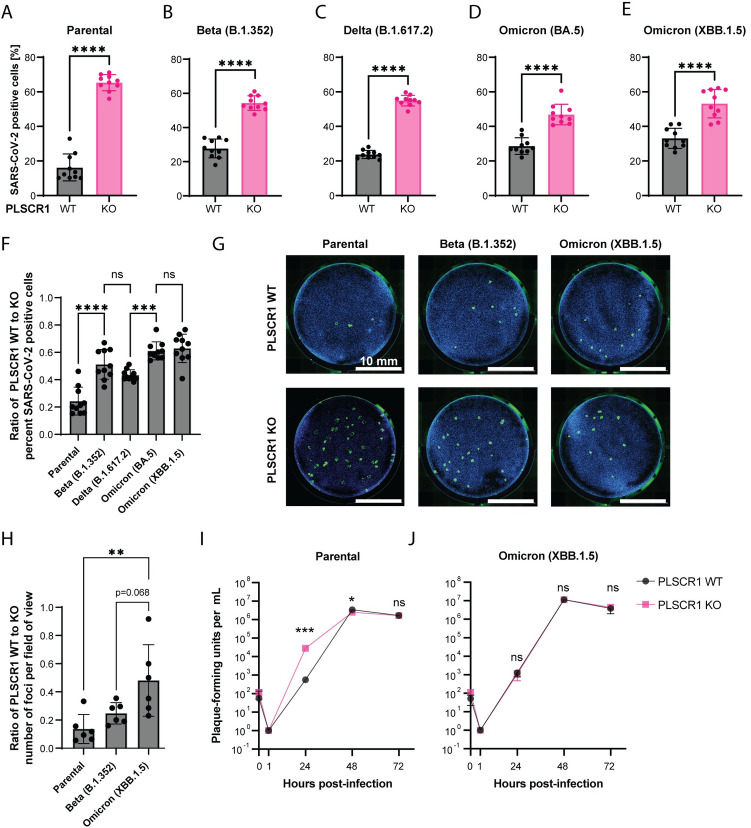
Fig 6. Newer variants of SARS-CoV-2 are less restricted by PLSCR1.
(A-E) Infection of Huh-7.5 cells with SARS-CoV-2 (parental) or its descendant variants, Beta, Delta, Omicron BA.5, and Omicron XBB.1.5 for 24 hours. SARS-CoV-2 N was stained by IF and the percentage of positive cells determined by imaging. n = 10 separate wells infected on the same day. Error bars represent SD; ****, p < 0.0001; two-tailed t test. (F) Ratio of WT/KO percent infection from (A-E). Error bars represent SD. ns, nonsignificant; ***, p ≤ 0.001; ****, p ≤ 0.0001; one-way ANOVA. (G) Focus forming assay on Huh-7.5 WT and PLSCR1 KO cells infected with approximately 50 FFU of SARS-CoV-2 variants as indicated. FFUs were determined on PLSCR1 KO Huh-7.5 cells. Representative images. (H) Foci from (G) were counted, and then a ratio of WT-to-KO plotted for each SARS-CoV-2 variant. n = 6 separate wells infected on the same day. Error bars represent SD. **, p ≤ 0.01; one-way ANOVA. (I) Virus production over an infectious time course (growth curve) for the parental SARS-CoV-2 strain. n = 2 to 3 separate wells infected on the same day. Error bars represent SD. ns, nonsignificant, *, p ≤ 0.05, ***, p ≤ 0.001, two-tailed t test on the log10-transformed values. (J) As in (I) with the Omicron (XBB.1.5) strain. The data underlying this Figure can be found in S1 Table. FFU, focus-forming unit; IF, immunofluorescence; KO, knockout; PLSCR1, phospholipid scramblase 1; SARS-CoV-2, Severe Acute Respiratory Syndrome Coronavirus 2; WT, wild type.

