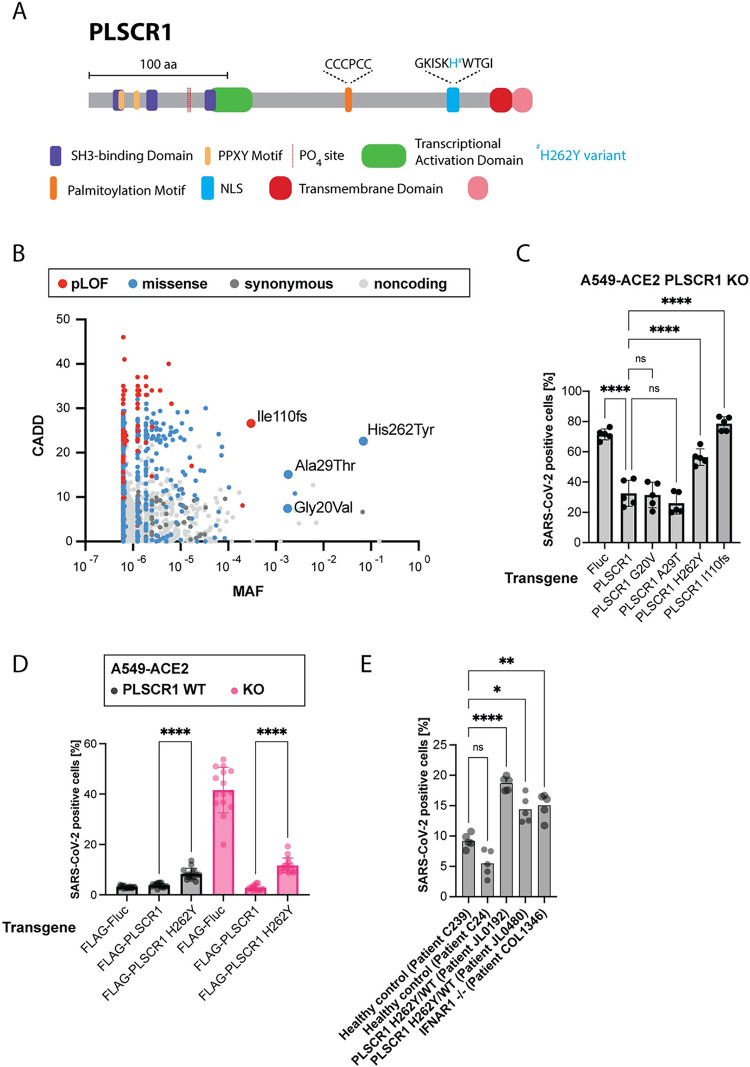
Fig 7. PLSCR1 p.His262Tyr, which associates with severe COVID-19, leads to higher SARS-CoV-2 infection in cell culture.
(A) Protein diagram of PLSCR1. Domain coordinates from UniProt [197]. (B) CADD MAF plot showing the common variants of the PLSCR1 gene reported in gnomAD [132,133]. The plot displays the CADD scores, indicating the predicted deleteriousness of each variant, against the MAF. (C) A549-ACE2 PLSCR1 KO cells were transduced to stably and ectopically express the indicated PLSCR1 variants. The cells were then infected for 24 hours with SARS-CoV-2. SARS-CoV-2 N was stained by IF and the percentage of positive cells determined by imaging. n = 4 separate wells infected on the same day. Error bars represent SD; **, p ≤ 0.01; ****, p < 0.0001; one-way ANOVA. (D) A549-ACE2 cells, WT and PLSCR1 KO, stably expressing N-terminal FLAG-tagged Fluc, N-terminal FLAG-tagged PLSCR1, or N-terminal FLAG-tagged PLSCR1 H262Y mutant and infected with SARS-CoV-2 for 24 hours. SARS-CoV-2 N was stained by IF and the percentage of positive cells determined by imaging. n = 15 separate wells infected on the same day. Error bars represent SD; ****, p ≤ 0.0001; two-tailed t test. (E) SV40-Fibroblast-ACE2 cells, genotype as indicated, infected for 24 hours with SARS-CoV-2. n = 8 separate wells infected on the same day. ns, nonsignificant; *, p ≤ 0.05; **, p ≤ 0.01; ****, p ≤ 0.0001; one-way ANOVA. The data underlying this Figure can be found in S1 Table. ACE2, angiotensin converting enzyme 2; CADD, Combined Annotation Dependent Depletion; COVID-19, Coronavirus Disease 2019; Fluc, Firefly Luciferase; Fs, frameshift; IF, immunofluorescence; KO, knockout; MAF, minor allele frequency; PLSCR1, phospholipid scramblase 1; SARS-CoV-2, Severe Acute Respiratory Syndrome Coronavirus 2; WT, wild type.

