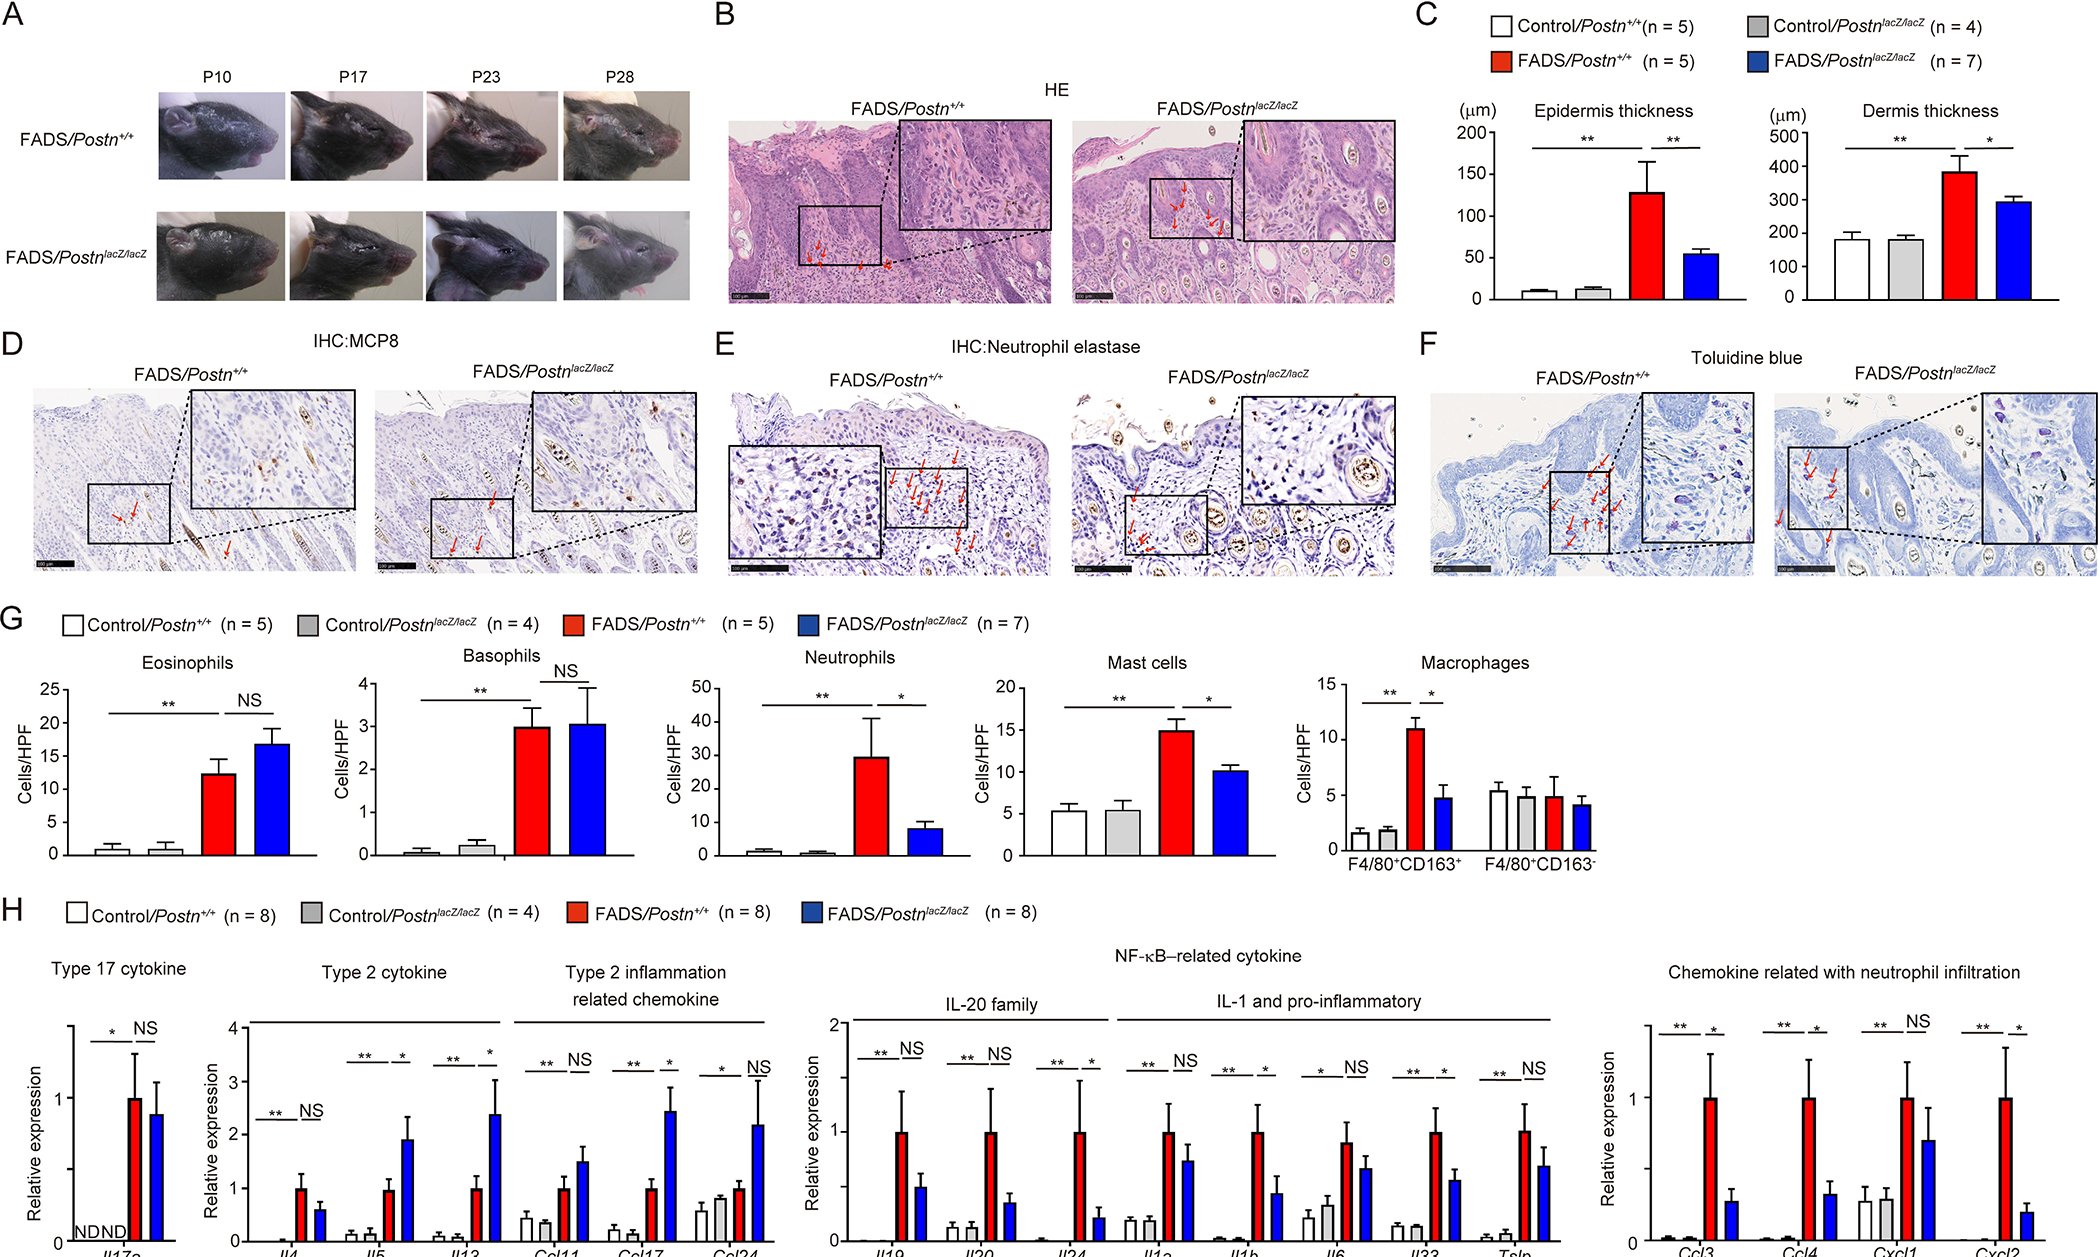
Figure 3. Improved progression of skin inflammation by genetic disruption of periostin in FADS mice.

(A) Macroscopic facial skin lesions of FADS/PostnlacZ/lacZ mice and FADS/Postn+/+ mice at the indicated periods after birth (See also Figures S1 and S2). Histological analysis of the facial skin of 4-week-old FADS/PostnlacZ/lacZ mice and FADS/Postn+/+ mice. (B-F) HE staining (B), epidermal and dermal thickness (C), mast cell protease 8 (MCP8) staining (D), neutrophil elastase staining (E), and toluidine blue staining (F) of 4-week-old control/Postn+/+ mice (n = 5), control/PostnlacZ/lacZ mice (n = 4), FADS/PostnlacZ/lacZ mice (n = 5), and FADS/Postn+/+ mice (n = 7). Red arrows indicate eosinophils (B), basophils (D), neutrophils (E) or mast cells (F). Scale bars: 100 μm. (G, H) The number per high-power field (HPF: ×40) of eosinophils, basophils, neutrophils, mast cells, and F4/80+CD163+ macrophages (G), quantitative real-time PCR analysis for cytokines and chemokines (H) of 4-week-old control/Postn+/+ mice (n = 8), control/PostnlacZ/lacZ mice (n = 4), FADS/Postn+/+ mice (n = 8), and FADS/PostnlacZ/lacZ mice (n = 8). In H, the relative gene expression levels were normalized to Gapdh. The mean expression levels for the facial skin of FADS/Postn+/+ mice are displayed as 1. The data shown are the mean ± SEM of samples obtained from three (G) or four (H) independent experiments. Statistical analysis was performed using a one-sided Mann-Whitney U-test; *P < 0.05, **P < 0.01. NS, not significant.
