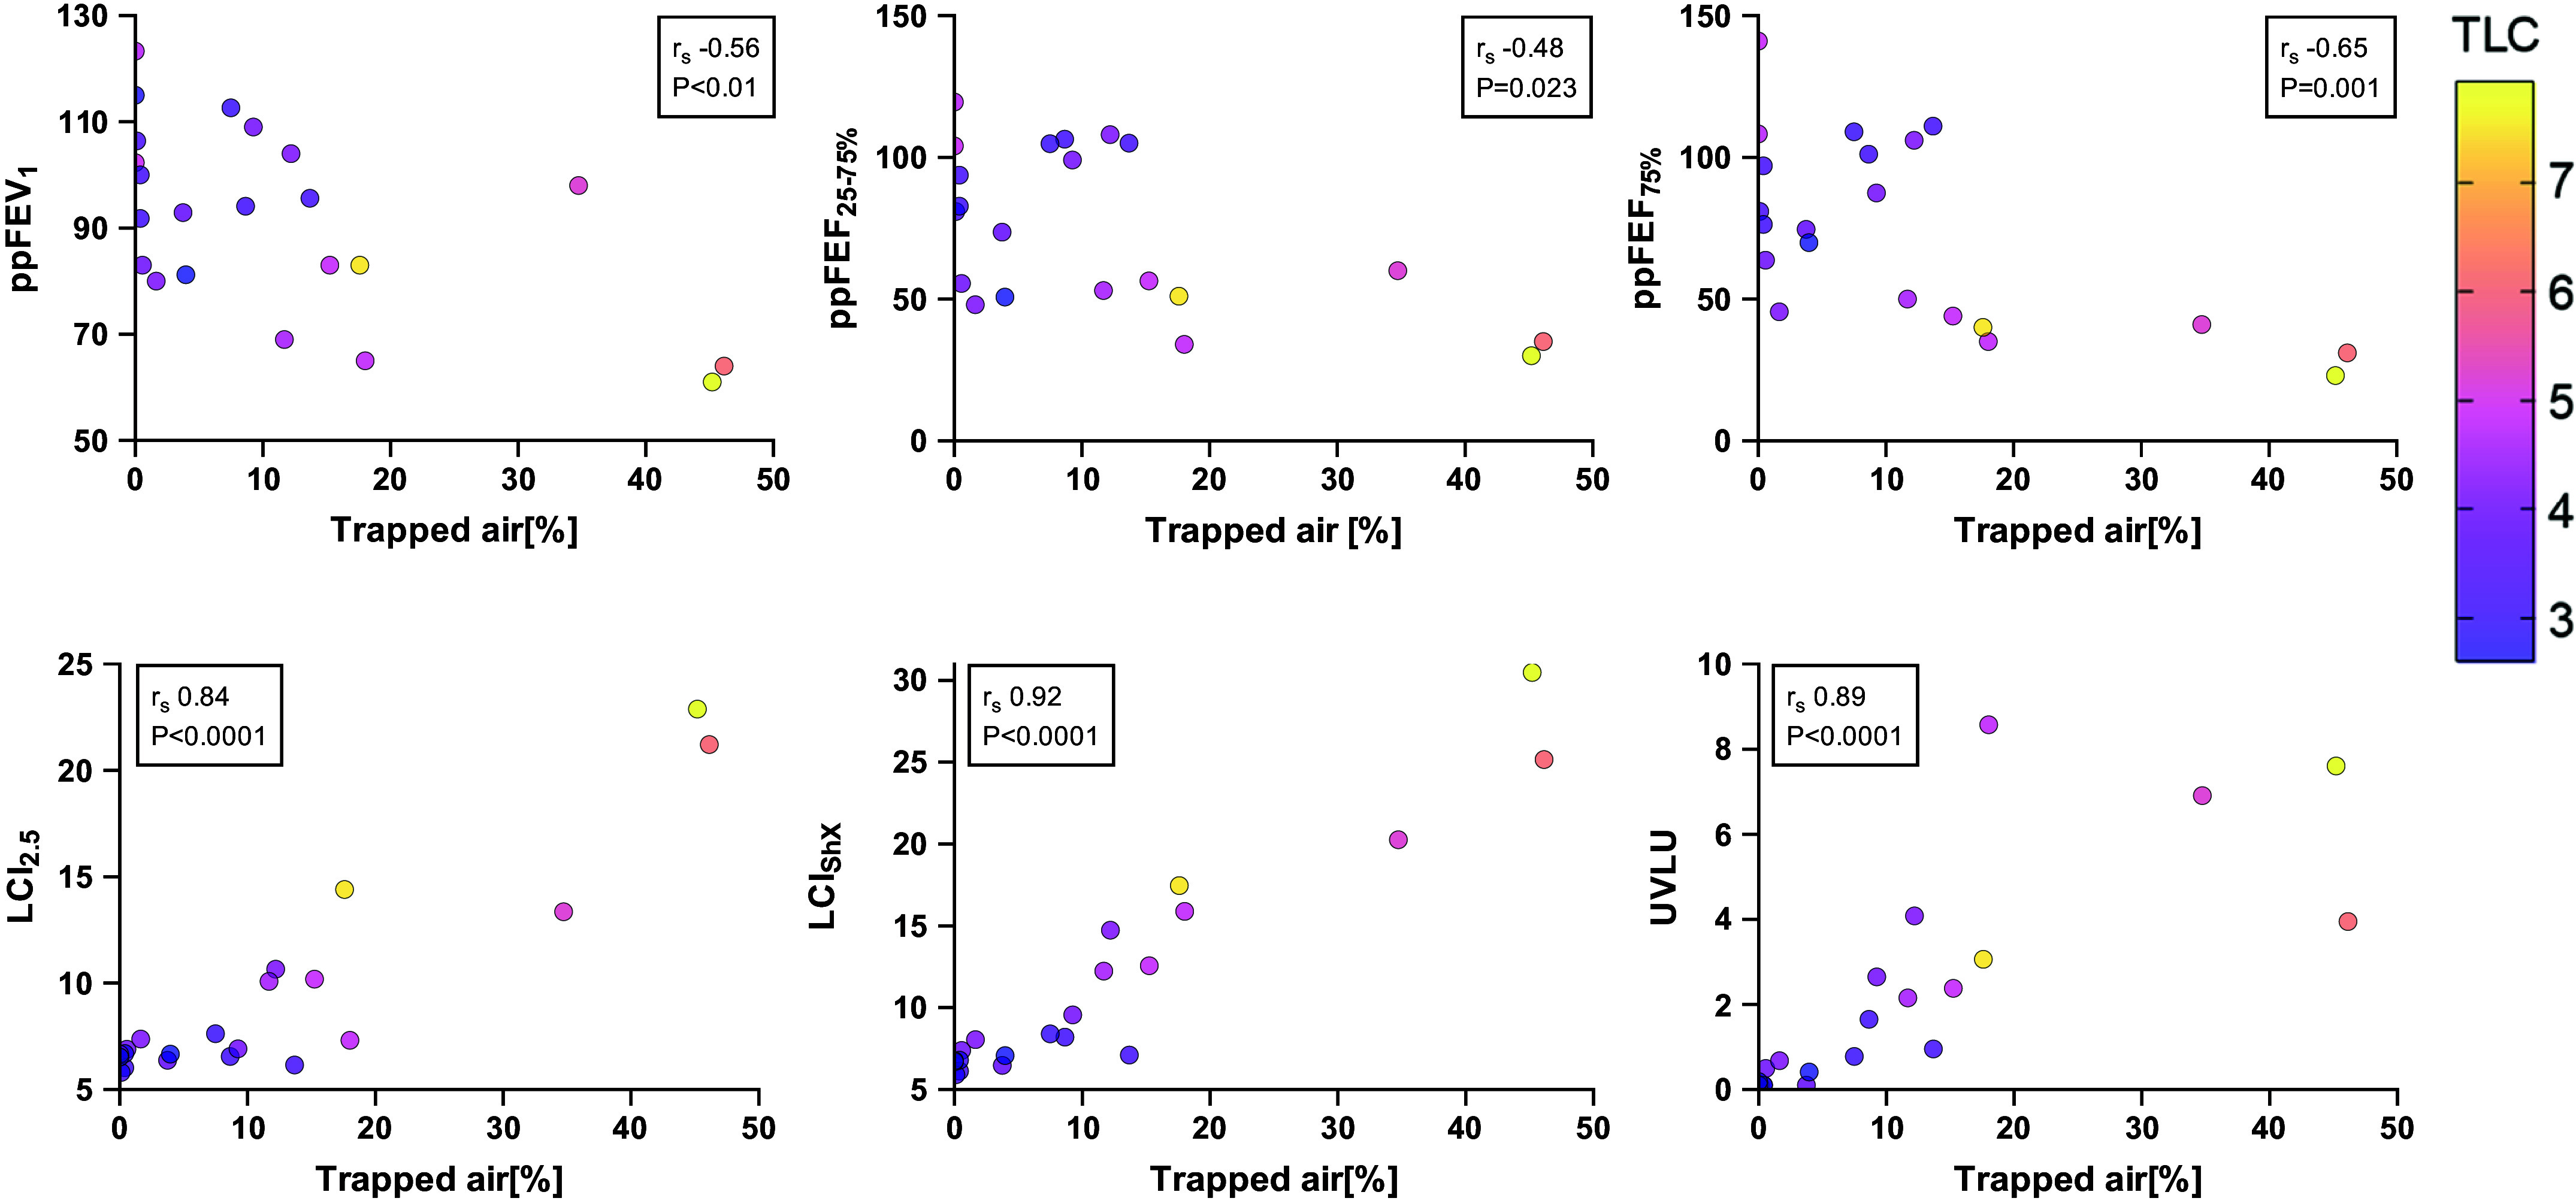
Figure 1.

Correlations between trapped air % from spirometry-controlled computed tomography and pulmonary function parameters including percent predicted (pp) forced expiratory volume in 1 second (FEV1), forced expiratory flow at 25–75% of the forced vital capacity (FVC) (FEF25–75%), flow when 75% of FVC has been exhaled (FEF75%) from spirometry and derivatives of Short extension multiple breath washout (MBWShX). Spearman’s correlation coefficient was used. Individual dots are color coded for a patient’s total lung capacity (TLC) which is measured in liters and is consistent on all scatter plots. UVLU, underventilated lung units.
