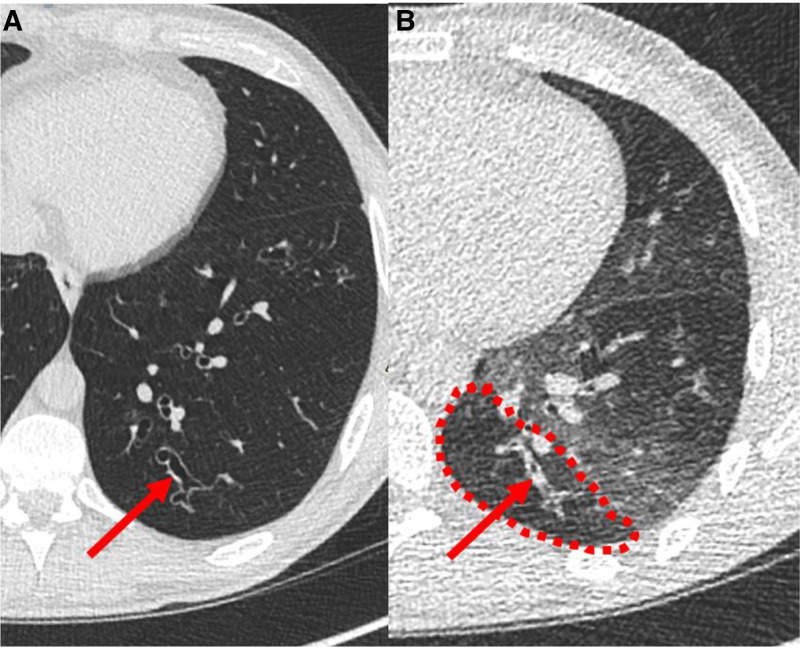
Figure 5.
Axial computed tomography (CT) with inspiratory image left (A) and expiratory image right (B), subsegmental posterior-basal left lower lobe. The airway pointed out with the red arrow is patent, but ectatic on the inspiratory image, but collapses on the forced expiratory image. The adjacent low attenuation (inside red dashed line) is generally interpreted as “small airways disease” or “trapped air,” but the nonphysiologic larger airways collapse could contribute to this appearance. This participant had a percent predicted forced expiratory volume in 1 second (ppFEV1) of 83% and Z-score of −1.36. The location of the collapsed airway is at the 6th generation, which is still within the proximal airways.

