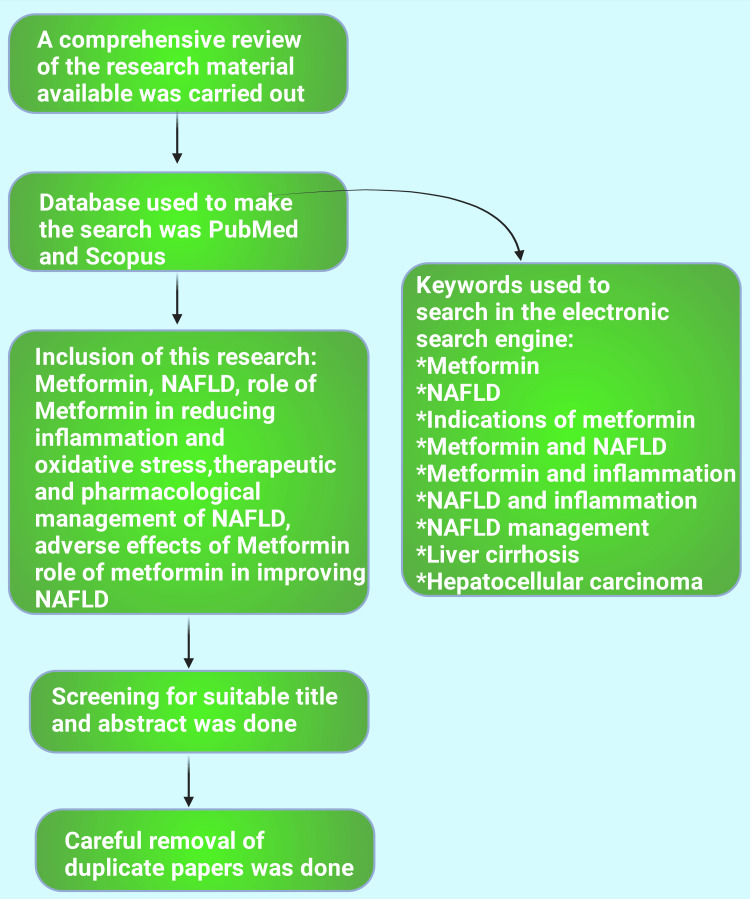
Figure 3. Flowchart depicting the materials and method section of the current study.
NAFLD: Non-alcoholic fatty liver disease.
This figure was drawn using the premium version of BioRender (https://biorender.com/), accessed on September 20, 2024 with the agreement license number DV27CQSXP4 [10].
Image credit: Rahnuma Ahmad.

