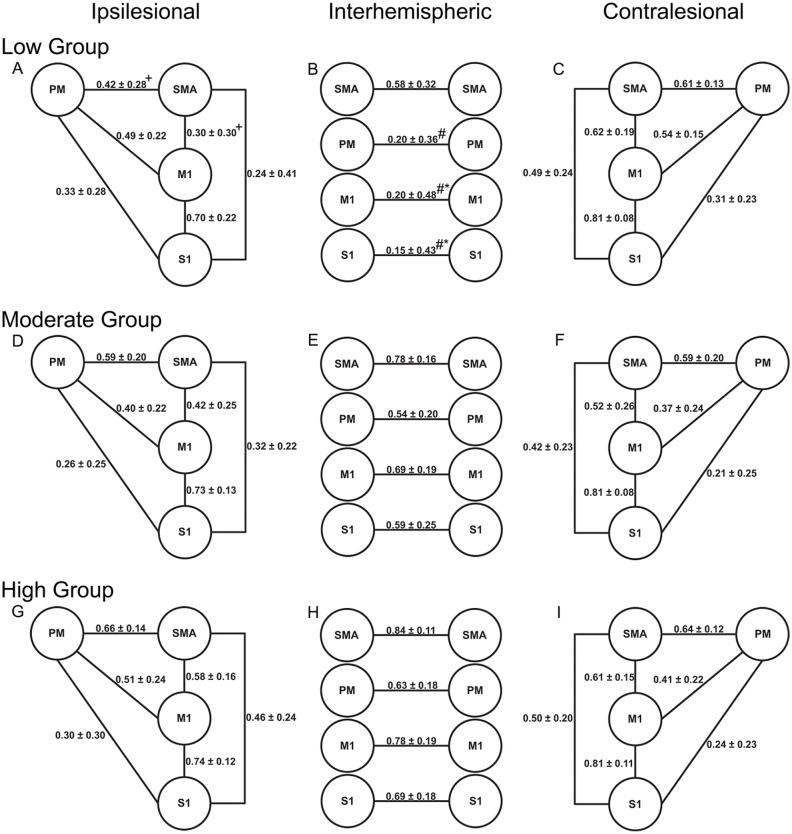
Figure 2.
Mean resting state functional connectivity for the ipsilesional, interhemispheric, and contralesional motor networks for the Low Group (A-C), Moderate Group (D-F) and High Group (H-I).
Values represent mean r values ± standard deviation (before Fisher’s Z transformation).
Abbreviations: M1, primary motor cortex; PM, premotor cortex; SMA, supplementary motor area; S1, primary sensory cortex.
+Significantly different from the High group (P < .006).
#Signifcantly different from the High Group (P < .002).
*Significantly different from the Moderate group (P < .008).

