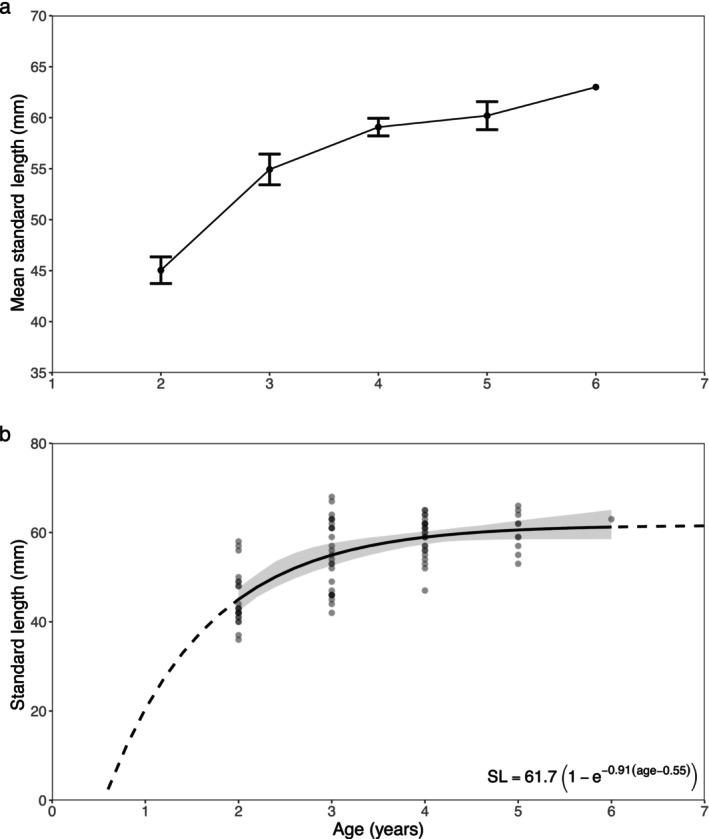
FIGURE 8.

(a) Mean standard length (mm) for each age group (years) of Benthosema glaciale collected during the IESSNS in July 2020. Error bars denote the standard error of the mean for each age. (b) Von Bertalanffy growth curve with bootstrapped 95% confidence intervals (gray shading). Dotted line depicts the estimated curve outside the range of the observed datapoints; dots depict values for each individual.
