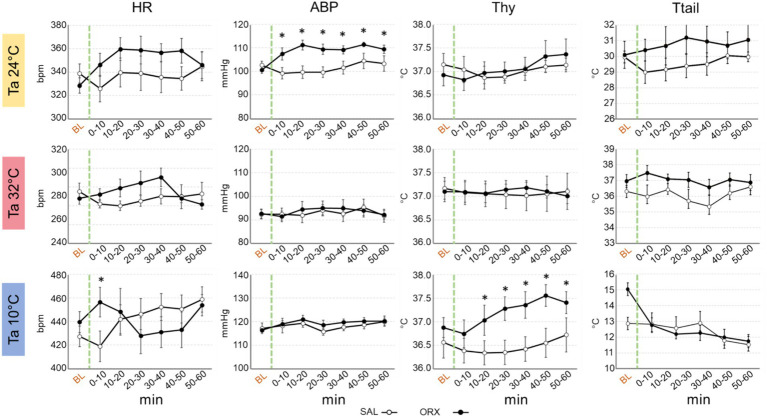
Figure 3.
Graphs depicting the mean value ± S.E.M. of heart rate (HR), arterial blood pressure (ABP), hypothalamic temperature (Thy) and tail temperature (Ttail), for the 60 min after the injection (green dashed line) of either saline (SAL, empty dots), or orexin (ORX, filled dots) in the Raphe Pallidus, at three different ambient temperatures (Tas). BL = baseline, indicates the mean value ± S.E.M. of the 30 min prior to the injection. The 60 min following the injection are showed in 10-min time bins. * = p < 0.05, green dashed line = injection time.

