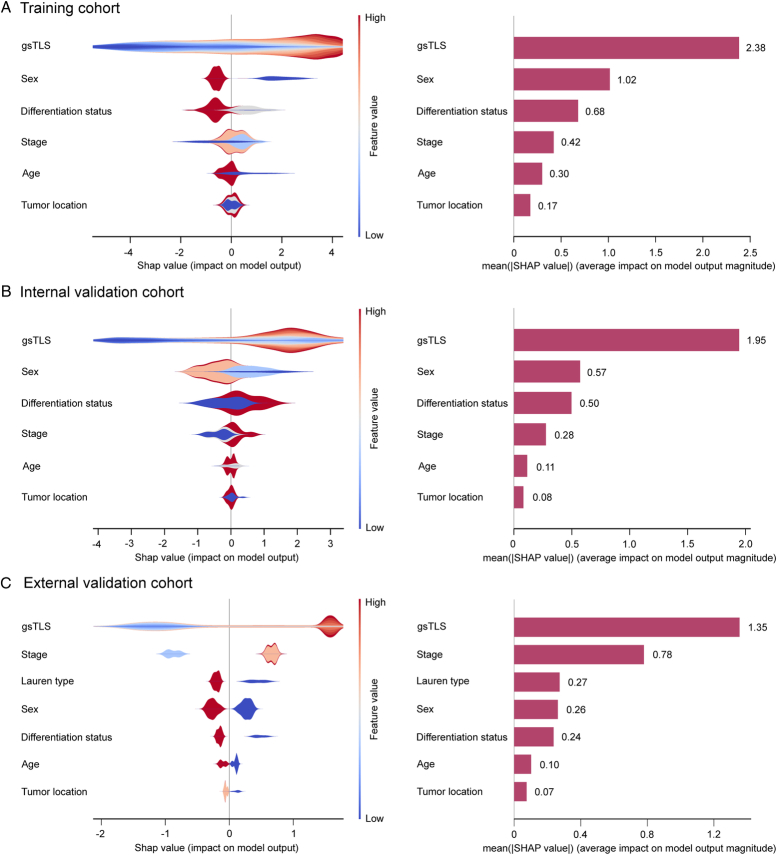
Figure 5.
SHAP interpretations on gsTLS and clinicopathologic factors to predict the H&E-based TLSs in the training cohort, internal and external validation cohorts. On the X-axis, the contribution of each feature is shown. The Shapley value is positively correlated with the importance. Moreover, a feature with a positive Shapley value will favorably impact the prediction (increase the possibility of TLSs presence). The influence of the value of the feature itself is shown on the Y-axis, for example, for gsTLS, a high value (in red) is associated with a positive Shapley value that will increase the possibility of TLSs presence, while a low value (in blue) will decrease the Shapley value and the possibility of TLSs presence. (A) SHAP plots of training cohort; (B) SHAP plots of internal validation cohort; (C) SHAP plots of external validation cohort. gsTLS, gene signature of tertiary lymphoid structures; H&E, hematoxylin-and-eosin; SHAP, SHapley Additive exPlanations.

