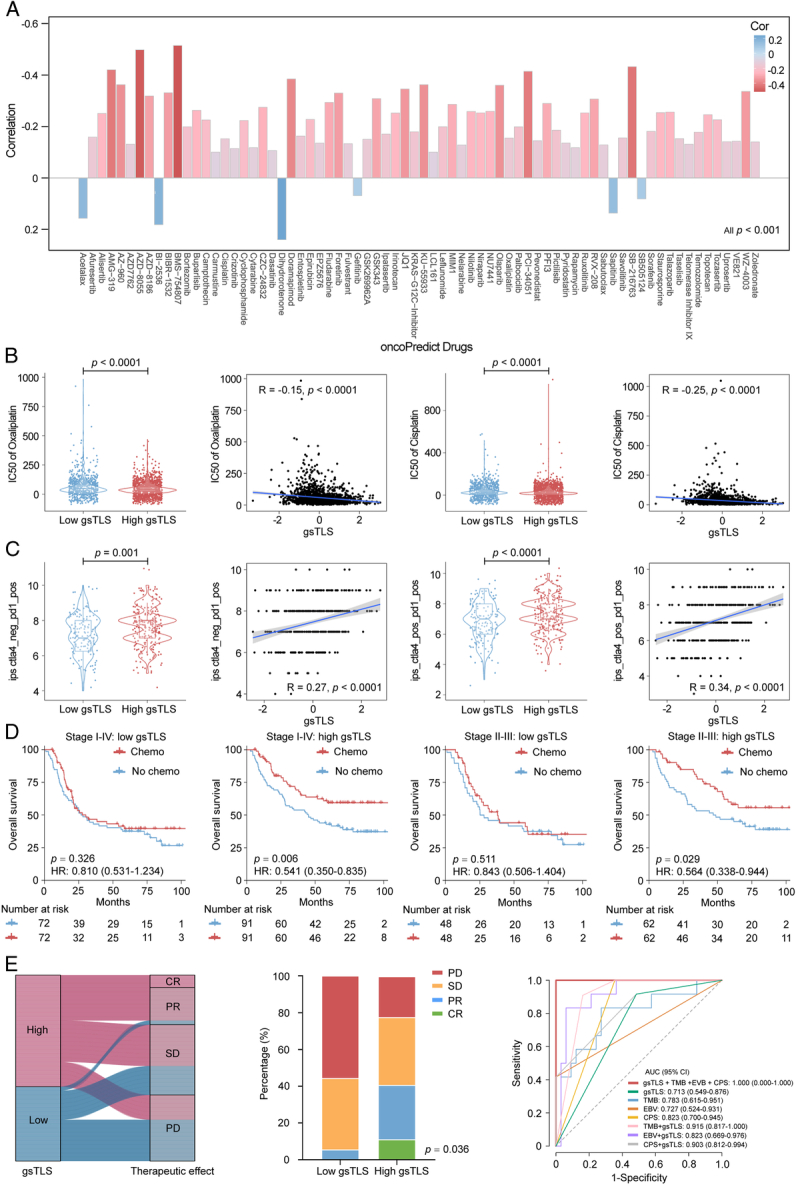
Figure 8.

Therapeutic responses predicted by the gsTLS. (A) Therapeutic responses to multiple drugs showed as IC50 predicted by the oncoPredict database; (B) Two representative drugs (oxaliplatin and cisplatin) from the oncoPredict database, for which patients in high-gsTLS group with a low IC50 exhibited sensitivity; (C) The predictive value of gsTLS for immunotherapy response presented by the TCIA database; (D) The predictive value of gsTLS for chemotherapy benefit in patients from the TCGA-STAD, ACRG, YUSH, SMC, and KRIBB cohorts with treatment records; (E) The predictive value of gsTLS for immunotherapy response in advanced gastric cancer undergone anti-PD-1 drug from the PRJEB25780 cohort. IC50, half maximal inhibitory concentration; gsTLS, gene signature of tertiary lymphoid structures; PD-1, programmed cell death protein 1; TCIA, The Cancer Immunome Atlas.
