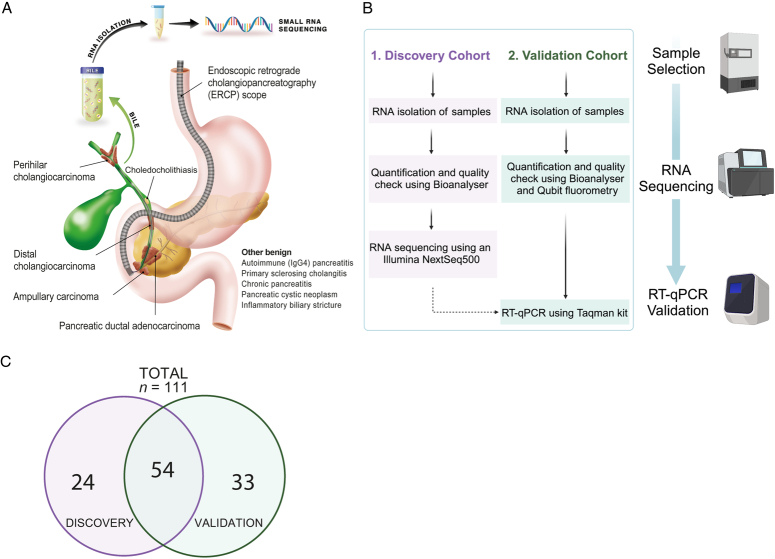
Figure 1.
Study design of the MIRABILE study. (A) A graphical figure demonstrating the overall study design together with relevant pancreaticobiliary diseases. (B) Schematic diagram showing the workflow: RNA was isolated from bile samples, followed by quantification and then either RNA sequencing analysis or RT-qPCR. (C) Venn diagram showing the distribution of patients between the discovery and validation cohorts used in the analysis of bile cfRNA. RT-qPCR, quantitative reverse transcription polymerase chain reaction.

