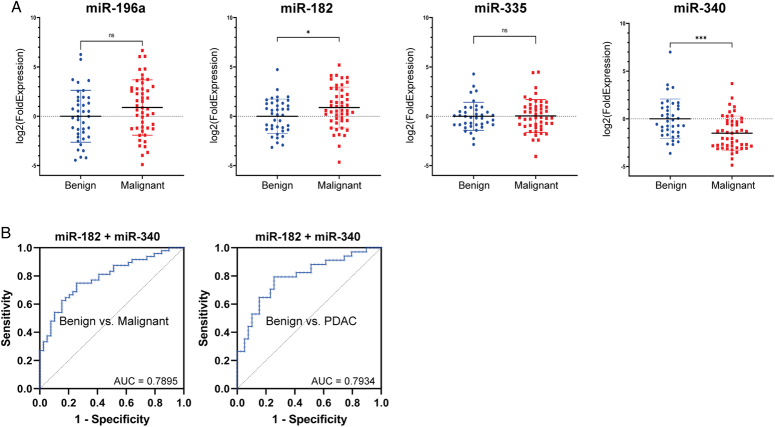
Figure 4.
RT-qPCR validation of candidate miRNAs identified by LASSO regression analysis. (A) Expression of candidate miRNAs in benign and malignant pancreaticobiliary disease (left to right): miR-196a, miR-182, miR-335 and miR-340. *P<0.05, **P<0.005, ***P<0.0005. (B) ROC curve with corresponding AUC value for the 2-miRNA signature (miR-182 and miR-340) to predict malignant disease vs. benign disease (left), or to predict PDAC vs. benign disease (right). AUC, area under the curve; PDAC, pancreatic ductal adenocarcinoma.

