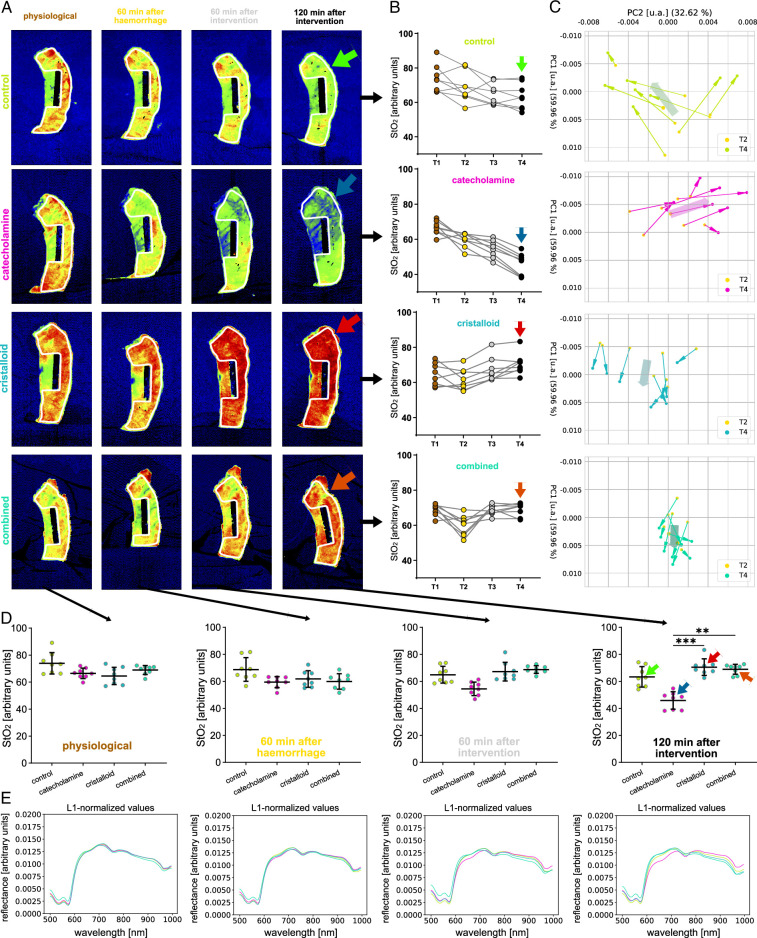
Figure 4.
Temporal course of changes in reflectance of the gastric conduit (T1, T2, T3, T4). HSI color index pictures, StO2 quantifications and respective spectra for the gastric conduit over the course of baseline (T1), after hemorrhage (T2), 60 min after intervention (T3) and 120 min after intervention (T4) stratified for interventional groups. A, HSI StO2 color index pictures. B, StO2 quantifications and respective spectra comparing groups. C, PCA visualizing the development from T2 to T4. D–E, StO2 quantifications and respective L1-normalized reflectance spectra comparing timepoints stratified for interventional groups. Scale bar equals 5.

