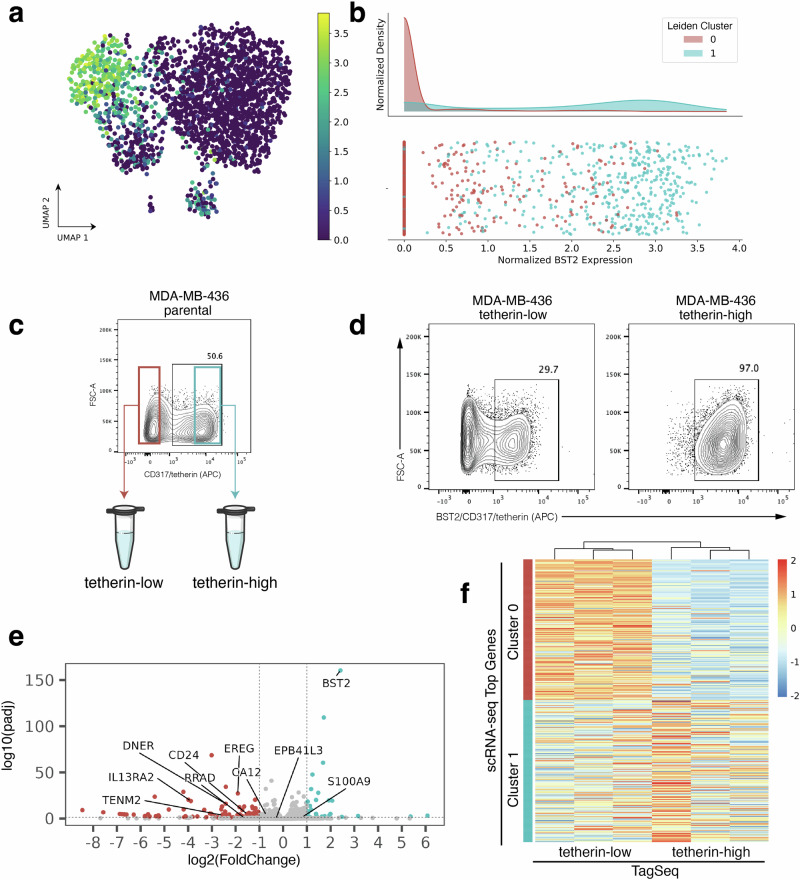
Fig. 4. Experimental validation of BST2/tetherin as a surface marker for MDA-MB-436 subpopulations.
a scRNA-seq UMAP projection of MDA-MB-436 cells colored by BST2 expression. b Histogram of BST2 expression showing enrichment of cluster 1 for BST2. c BST2 encodes the protein product tetherin/CD317 and tetherin immunostaining reveals subpopulations within parental MDA-MB-436 cells. Cells with the lowest immunostaining were FACS enriched as “tetherin-low” and cells with the highest immunostaining as “tetherin-high” (d) At the time of RNA collection (13 days post-FACS and expansion), sorted the sorted tetherin-high subpopulation maintained 97% purity by tetherin immunostaining and flow cytometry analysis (d, right), however, the tetherin-low subpopulation dropped to 70% purity (d, left). e Volcano plot of differentially expressed genes from TagSeq performed on sorted subpopulations. Labels point to genes that were highly ranked in the scRNA-seq EMD. f Heatmap of TaqSeq data for each FACS enriched subpopulation (tetherin-low, left; tetherin-high, right) plotted against ranked cluster genes from scRNA-seq (Cluster 0, top; Cluster 1, bottom).

