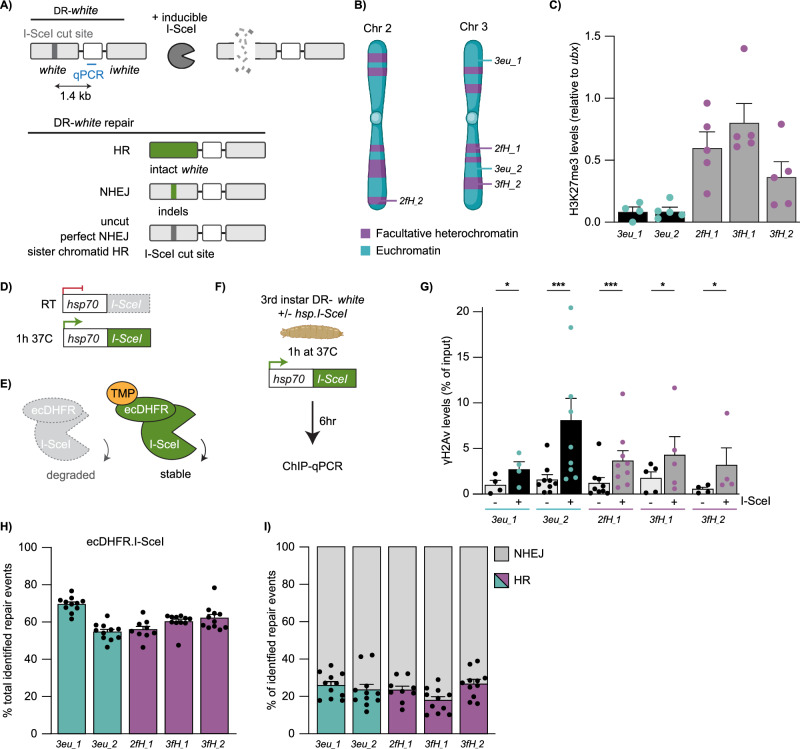
Fig. 1. DR-white system to induce single DSBs in euchromatin and facultative heterochromatin.
A Schematic of the DR-white system as previously established in22. I-SceI expression creates a DSB in the upstream white gene. Homologous recombination (HR) with the iwhite sequence (intra-chromosomally or with the sister chromatid) results in loss of the I-SceI cut site (−23bp). Imperfect non-homologous end joining (NHEJ) may result in indels at the DSB site. Perfect NHEJ or HR using the I-SceI sequence on the sister chromatid can recreate the I-SceI cut site. B Schematic of DR-white integration sites in five fly lines (2× in euchromatin [3eu_1, 3_eu2] and 3× in facultative heterochromatin [2fH_1, 3fH_1, 3fH_2]). Created in BioRender. Janssen, A. (2021) BioRender.com/h58g617. C ChIP-qPCR analysis for H3K27me3 at the DR-white locus (primers Fig. 1A). H3K27me3 levels were normalized using ubx gene primers (ubx has high H3K27me3 levels63). Averages +SEM are shown for n = 5 biological replicates (except 3eu_1: n = 4). p-values: 3eu_1 = 0.0350, 3eu_2 = 0.0009, 2fH_1 = 0.0006, 3fH_1 = 0.0333, 3fH_2 = 0.0432. D Schematic of the hsp.I-SceI construct. The hsp70 promoter upstream of I-SceI can be activated by shifting larvae for one hour (1 h) to 37 °C. RT=room temperature. E Schematic of the ecDHFR-I-SceI system. Proteasomal degradation of ecDHFR-I-SceI can be blocked by adding trimethoprim (TMP). F Experimental set up for ChIP-qPCR experiments. 3rd instar DR-white larvae with and without hsp.I-SceI (control) were heat-shocked. Six hours later chromatin was subjected to ChIP-qPCR (primers Fig. 1A). Figure partly created in BioRender. Janssen, A. (2024) BioRender.com/n98i722. G ChIP-qPCR analysis for yH2Av in the absence (-) and presence (+) of hsp.I-SceI (as in F). Averages +SEM are shown for n = 4 (3eu_1, 3fH_2), n = 5 (3fH_1), or n = 9 (3eu_2, 2fH_1) biological replicates. H, I DR-white/ecDHFR-I-SceI larvae were fed TMP for 3-4 days. Repair products at the upstream white gene were amplified and analyzed using TIDE37. Graphs show the total identified repair events in all PCR products (H) and the percentage of repair products with either HR (color) or NHEJ (gray) signatures (I). Bars indicate averages +SEM of n = 11 single larvae (biological replicates) (except 2fH_1: n = 9). If not shown, p-value (>0.05), (*) p-value ≤ 0.05, (***) p-value ≤ 0.001, ratio two-sided paired t-test (G), one-way ANOVA + Tukey’s multiple comparisons test (I). Source data are provided as Source Data file.

