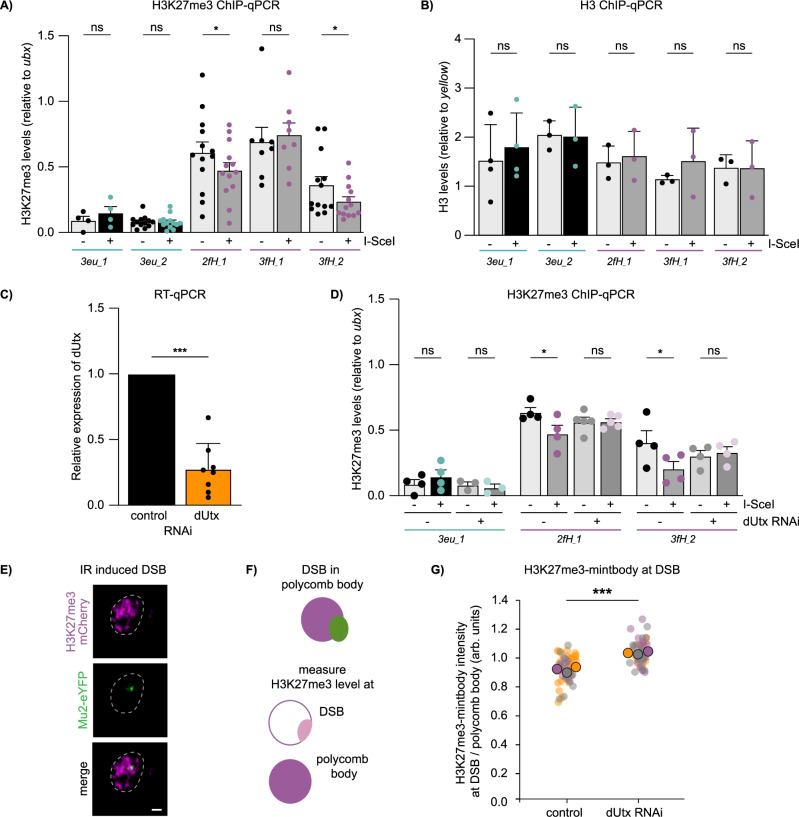
Fig. 3. Loss of H3K27me3 at facultative heterochromatic DSBs is mediated by dUtx.
A, B ChIP-qPCR analysis for H3K27me3 (A) and H3 (B) in the absence (-) and presence (+) of hsp.I-SceI (as in Fig. 1F) at indicated DR-white integration sites. H3K27me3 levels were normalized using a ubx qPCR primer set as an internal positive control and H3 levels using a yellow qPCR primer set. Averages +SEM are shown for n = 13 biological replicates (except 3eu_1: n = 4 and 3fH_1: n = 8) (A) and n = 3 biological replicates (except 3eu_1: n = 4) (B). p-values: 2fH_1 = 0.0340, 3fH_2 = 0.0482. C Relative dUtx expression level in 3rd instar larvae determined using RT-qPCR and normalized to an internal control gene (tubulin). Bars indicate averages +SD of 8 single larvae (biological replicates) per condition (luciferase control RNAi or dUtx RNAi). p-value < 0.0001. D ChIP-qPCR analysis for H3K27me3 in the absence or presence of a DSB (-/+ hsp.I-SceI), with or without dUtx RNAi (as in Fig. 1F). H3K27me3 levels were normalized as in A. Averages +SEM are shown for n = 4 biological replicates (except 3eu_1 (dUtxRNAi): n = 3, 2fH_1 (dUtxRNAi): n = 5). p-values: 2fH_1 –dUtx RNAi=0.0216, 3fH_1 –dUtx RNAi = 0.0431. E Representative image of irradiation-induced Mu2-eYFP focus (DSB marker, green) within the H3K27me3-mintbody domain (polycomb marker, magenta) in S2 cells within 30 min after 5 Gy IR. Scale bar = 1 μm. Dotted line outlines nucleus. F Schematic of the quantification of H3K27me3 levels at DSBs in polycomb bodies. Relative enrichment of H3K27me3 at DSBs is calculated by dividing H3K27me3 levels at the DSB (light pink) by H3K27me3 levels at the complete polycomb body (magenta). G Quantification of relative enrichment of H3K27me3 levels at DSBs in polycomb bodies with or without dUtx depletion, within 30 min after IR (quantification as in F). Graph represents three biological replicates per condition. Each big circle (gray, purple, orange) represents the average intensity of one experiment. Small circles represent individual cells within one experiment, arb. units = arbitrary units. p-value: 0.0009. (ns) not significant, (*) p-value ≤ 0.05, (***) p-value ≤ 0.001, two-sided paired t-test (A–D) and two-sided unpaired t-test (G). Source data are provided as Source Data file.

