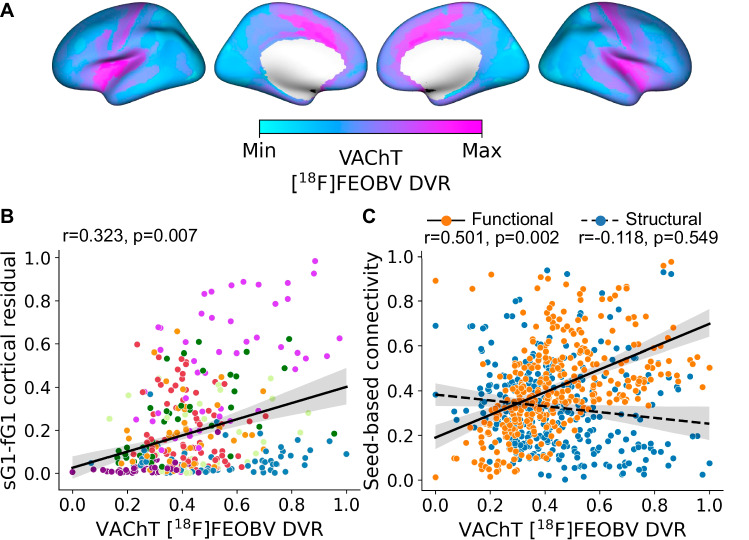
Fig. 4. Multimodal gradients of basal forebrain (BF) connectivity in relation to in vivo molecular imaging of VAChT with [18F]FEOBV PET.
A Average VAChT concentrations for 13 cognitively normal younger adults reveal the density of presynaptic cholinergic terminals across the cortical surface. The values of each cortical parcel were rescaled115 between 0 (Min, light blue) and 1(Max, pink), Max indicating a higher concentration of cholinergic nerve terminals. B The spatial relationship of cortical VAChT concentrations (panel A) with the cortical map encoding BF structure-function tethering (Fig. 2F). Each point in the scatter plot represents cortical parcels based on HCP-MMP 1.0 parcellation41 color-coded according to the Yeo networks35 (Fig. 3B). Spin tests48, as implemented in the neuromaps toolbox38, were used to calculate Pearson’s correlation and p-value based on n = 10k permutations. The solid line is the regression line. The shaded area represents the size of the 95% confidence interval for the regression estimate. The confidence interval is estimated using a non-parametric bootstrap procedure. C The spatial relationship of cortical VAChT concentrations (panel A) with seed-based connectivity for the BF structural (blue) and functional (orange) datasets. Spin tests48, as implemented in the neuromaps toolbox38, were used to calculate Pearson’s correlation and p-value based on n = 10k permutation. The solid line is the regression line. The shaded area represents the size of the 95% confidence interval for the regression estimate. The confidence interval is estimated using a non-parametric bootstrap procedure. Source data are provided as a Source Data file.

