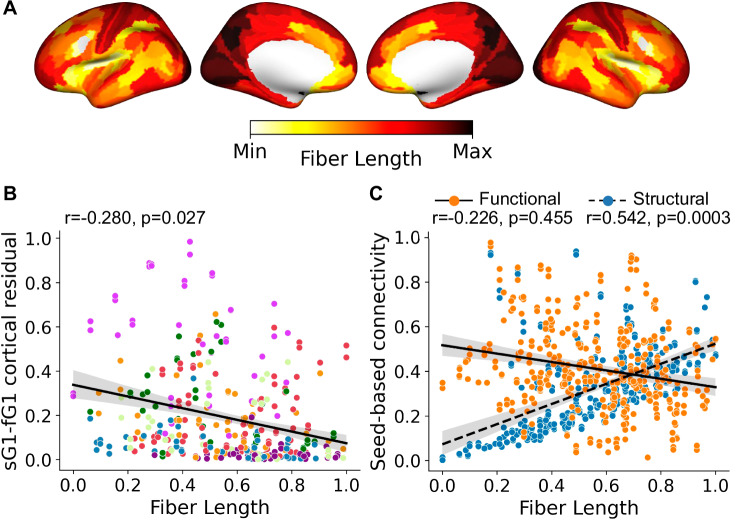
Fig. 5. Multimodal gradients of basal forebrain (BF) connectivity in relation to diffusion tractography estimates of white matter fiber lengths.
A Average white matter fiber lengths for 173 cognitively normal younger adults reveal cortical areas receiving the longest BF projections located in the primary visual and somatomotor cortices. The values of each cortical parcel were rescaled115 between 0 (Min, yellow) and 1(Max, dark red), Max indicating the longest white matter fibers from the BF. B The spatial relationship of BF white matter fiber lengths (panel A) with the cortical map encoding BF structure-function tethering (Fig. 2F). Each point in the scatter plot represents cortical parcels based on HCP-MMP 1.0 parcellation41 color-coded according to the Yeo networks35 (Fig. 3B). Spin tests48, as implemented in the neuromaps toolbox38, were used to calculate Pearson’s correlation and p-value based on n = 10k permutations. The solid line is the regression line. The shaded area represents the size of the 95% confidence interval for the regression estimate. The confidence interval is estimated using a non-parametric bootstrap procedure. C The spatial relationship of BF white matter fiber lengths (panel A) with seed-based connectivity for the BF structural (blue) and functional (orange) datasets. Spin tests48, as implemented in the neuromaps toolbox38, were used to calculate Pearson’s correlation and p-value based on n = 10k permutations. The solid line is the regression line. The shaded area represents the size of the 95% confidence interval for the regression estimate. The confidence interval is estimated using a non-parametric bootstrap procedure. Source data are provided as a Source Data file.

