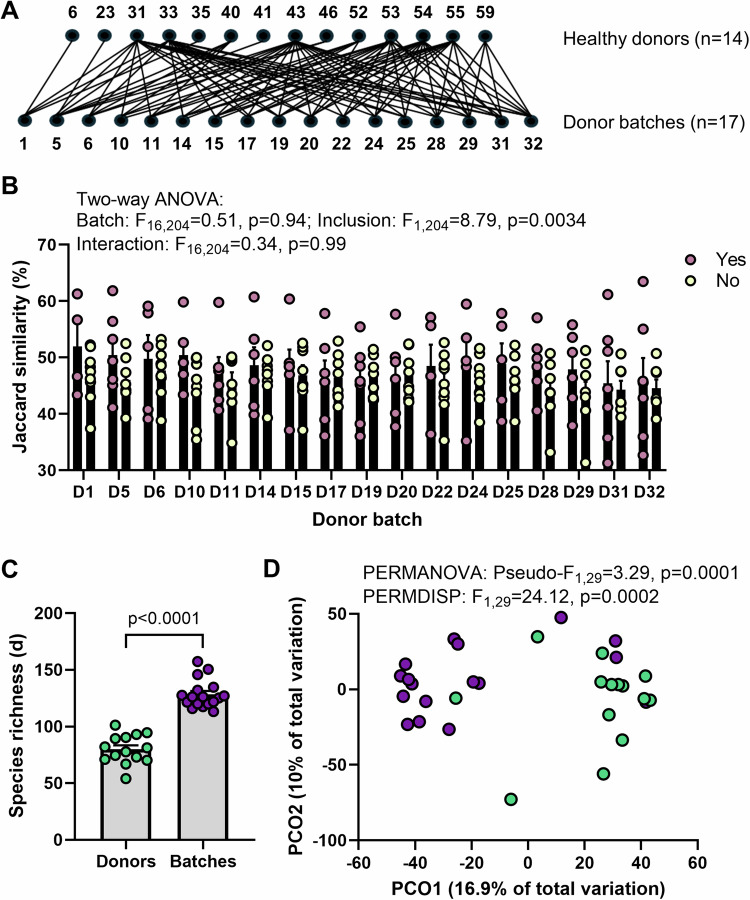
Fig. 1. Quality assessment of phage identification.
A The FOCUS trial design which included the combination of 4–7 individual donors into donor batches was employed to determine the accuracy of the phage mining strategy used. Only FOCUS vOTUs that were classified as a virus (n = 2737) were included in the analysis. B Jaccard similarity of the donor batches (D1, D5, D6, D10, D11, D14, D15, D17, D19, D20, D22, D24, D25, D28, D29, D31, D32) to the individual donors included (Yes, pink; n = 4, 7, 5, 5, 6, 6, 6, 6, 7, 6, 5, 5, 5, 6, 6, 7, 7, respectively) and not included (No, yellow; n = 10, 7, 9, 9, 8, 8, 8, 8, 7, 8, 9, 9, 9, 8, 8, 7, 7, respectively) in the batch. Differences were tested using two-way ANOVA with Batch x Inclusion as variables. Errors are ± SEM. C Margalef’s (species) richness in the individual donors (n = 14) and batches (n = 17). Differences were tested using a two-sided Mann-Whitney test (p < 0.0001) following assessment of normal distribution with Shapiro–Wilk test (Donors: p = 0.9537, Batches: p = 0.0293). Errors are ± SEM. D Principal coordinate analysis (PCO) on Aitchinson distances between individual donor (green) and donor batch samples (purple). Differences between groups were tested using PERMANOVA and PERMDISP. Source data are provided as a Source Data file.

