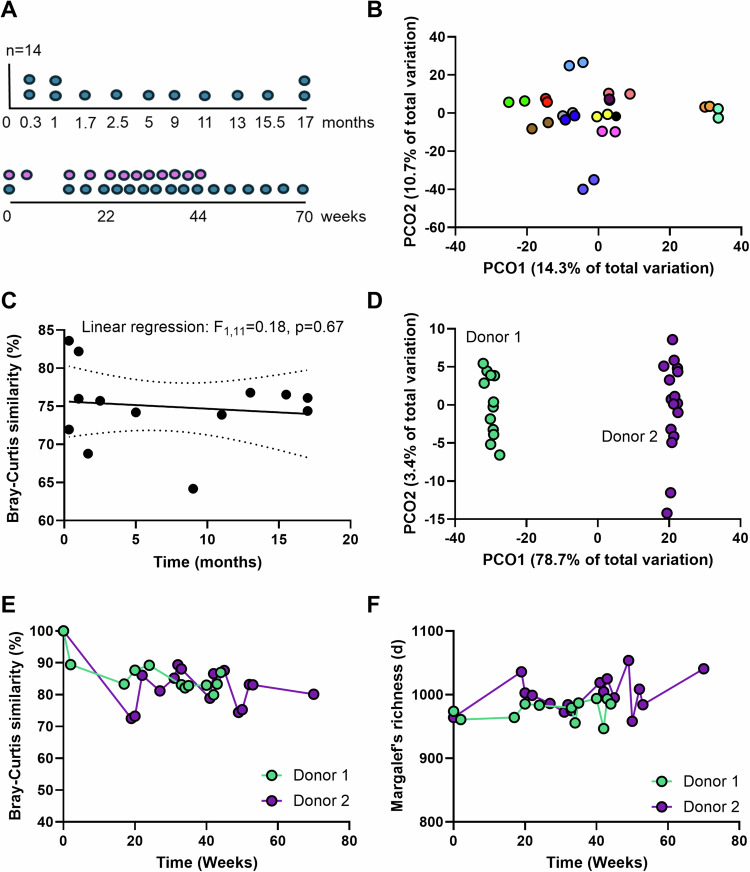
Fig. 2. Phage diversity in healthy individuals.
Donors from both clinical trials represent individuals that have been clinically validated as healthy. A Sampling from the donors in the FOCUS trial (top) and LOTUS trial (bottom). 14 donors in FOCUS were included and sampled at their baseline (0 months). 13 of 14 were sampled a second time over a period ranging from 0.3 to 17 months (blue points). Two donors in LOTUS were included that were sampled over 44 weeks (donor 1, n = 12, pink) and 70 weeks (donor 2, n = 17, blue). B Principal coordinate analysis (PCO) on Bray–Curtis similarities between samples from the individual donors. Only FOCUS vOTUs that were classified as a virus (n = 2737) were included in the analysis. C Linear regression between Bray-Curtis similarities intra-donor against time (months). The center line is linear regression equation and broken lines represent 95% confidence intervals. D PCO on Bray–Curtis similarities between samples from the two donors in LOTUS. The majority of the variation is observed inter-donor (PCO1 axis). Only LOTUS vOTUs that were classified as a virus (n = 25941) were included in the analysis. E Bray–Curtis similarities between samples from each donor in LOTUS over time. Values represent similarity with the sample prior in time with the first sample set at 100%. F Changes in Margalef’s (species) richness in samples from each donor in LOTUS over time. Source data are provided as a Source Data file.

