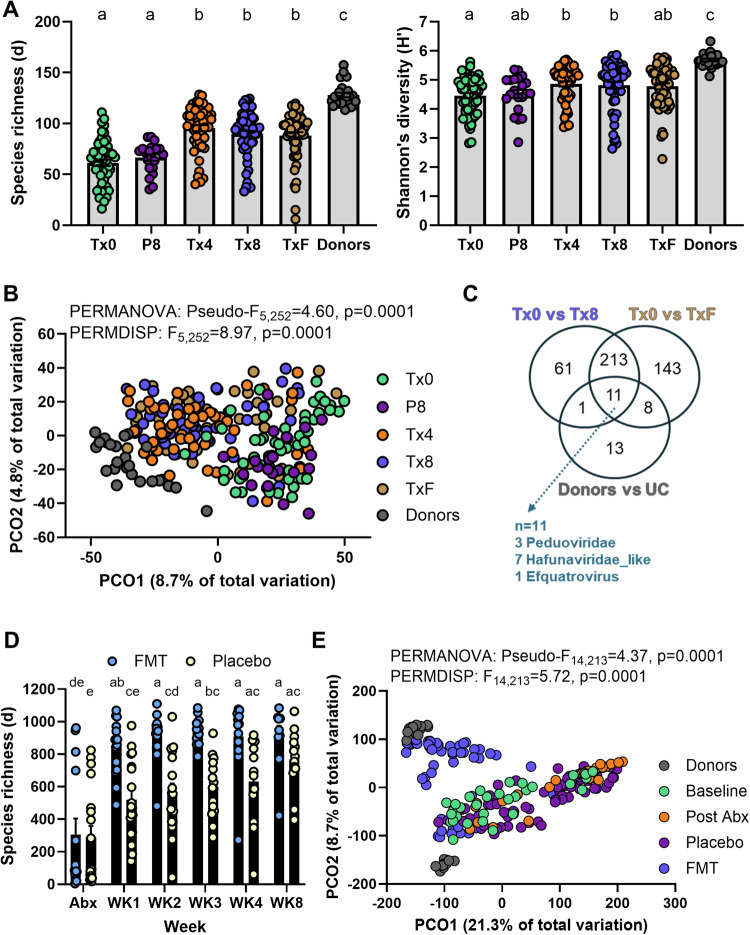
Fig. 5. Effect of fecal microbiota transplantation on phage diversity.
FOCUS and LOTUS vOTUs that were classified as a virus (n = 2737 and n = 25941, respectively) were included in the analysis where applicable. A Margalef’s (species) richness and Shannon’s diversity index of FOCUS donor batches (Donors, n = 17), patients at baseline (Tx0, n = 53), post 8 weeks of placebo (P8, n = 21), 4 weeks of FMT (Tx4, n = 53), 8 weeks of FMT (Tx8, n = 53) and at follow-up 8 weeks following FMT (TxF, n = 53). Differences for both metrics were tested using a Kruskal–Wallis test with a Dunn’s multiple comparisons test following assessment of normal distribution with Shapiro–Wilk test. Letters represent statistical significance. Errors are ± SEM. B Principal coordinate analysis (PCO) on Aitchinson distances for FOCUS samples across all groups. Differences between groups were tested using PERMANOVA and PERMDISP. C Venn diagram of significantly differentially abundant vOTUs identified by ZicoSeq across different comparisons in FOCUS samples (FMT: Tx0 vs Tx8, Follow-up post FMT: Tx0 vs TxF, and disease: donors vs UC). D Margalef’s (species) richness across time during FMT (Abx, n = 14; WK1, n = 15; WK2, n = 13; WK3, n = 11; WK4, n = 12; WK8, n = 10) or placebo (Abx, n = 18; WK1, n = 18; WK2, n = 17; WK3, n = 15; WK4, n = 12; WK8, n = 13) in LOTUS. Differences were tested using two-way ANOVA with Treatment x Week as variables (Treatment: p < 0.0001, Week: p < 0.0001, Interaction: p = 0.0376). Šídák’s multiple comparisons test was applied to identify differences across groups and statistical significance was represented as letters. Errors are ± SEM. E Principal coordinate analysis (PCO) on Aitchinson distances for LOTUS samples across all groups. Differences between groups were tested using PERMANOVA and PERMDISP. Donors, n = 29 samples from 2 donors; Baseline, n = 31 patients; Post Abx, n = 32 patients; Placebo, n = 75 samples; FMT, n = 61 samples. Source data and p-values for panels a and d are provided as a Source Data file.

