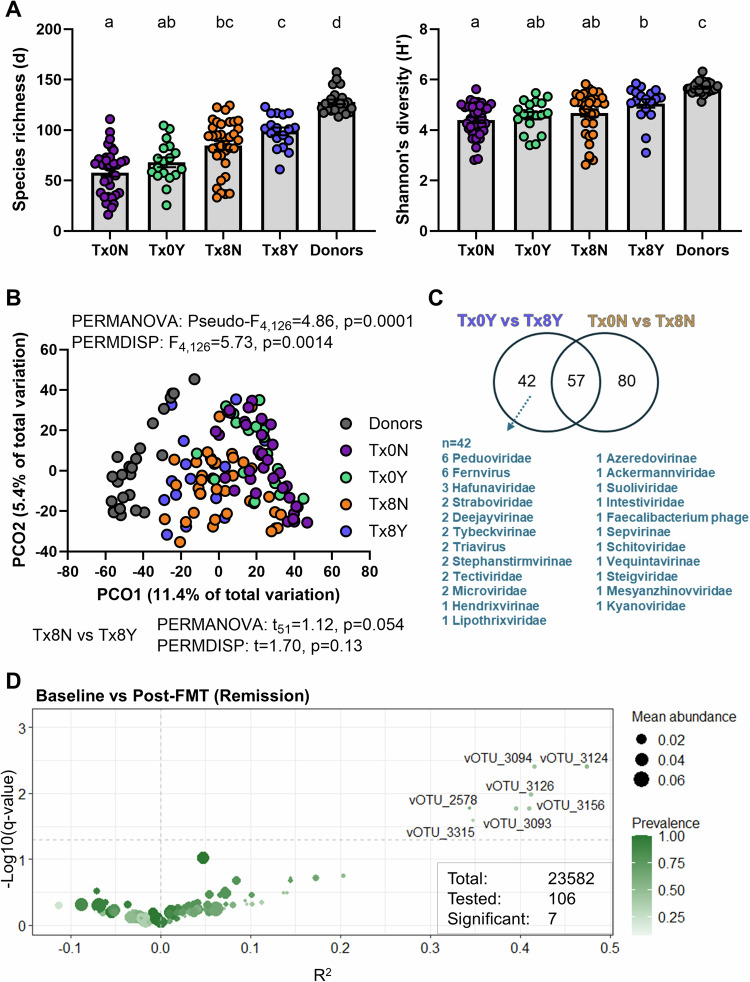
Fig. 6. Phage diversity and response to fecal microbiota transplantation.
FOCUS and LOTUS vOTUs that were classified as a virus (n = 2737 and n = 25941, respectively) were included in the analysis where applicable. A Margalef’s (species) richness and Shannon’s diversity index FOCUS donor batches (Donors, n = 17), non-responders at baseline (Tx0N, n = 35), responders at baseline (Tx0Y, n = 18), non-responders post FMT (Tx8N, n = 35) and responders post FMT (Tx8Y, n = 18). Differences for both metrics were tested using a Kruskal–Wallis test with a Dunn’s multiple comparisons test following assessment of normal distribution with Shapiro–Wilk test. Letters represent statistical significance. Errors are ± SEM. B Principal coordinate analysis (PCO) on Aitchinson distances for FOCUS samples across all groups. Differences between groups were tested using PERMANOVA and PERMDISP. Pairwise PERMANOVA and PERMDISP were performed to identify differences between Tx8N and Tx8Y. C Venn diagram of significantly differentially abundant vOTUs identified by ZicoSeq across different comparisons in FOCUS samples (Responders: Tx0Y vs Tx8Y, Non-responders: Tx0N vs Tx8N). D Differential abundance analysis of vOTUs of interest between patients at baseline (Baseline) and following FMT (Post-FMT) in the LOTUS dataset. Analysis with ZicoSeq was restricted to the 106 vOTUs that showed homology with the 42 vOTUs identified to be differentially abundant in responders in FOCUS. Source data and p-values for panel A are provided as a Source Data file.

