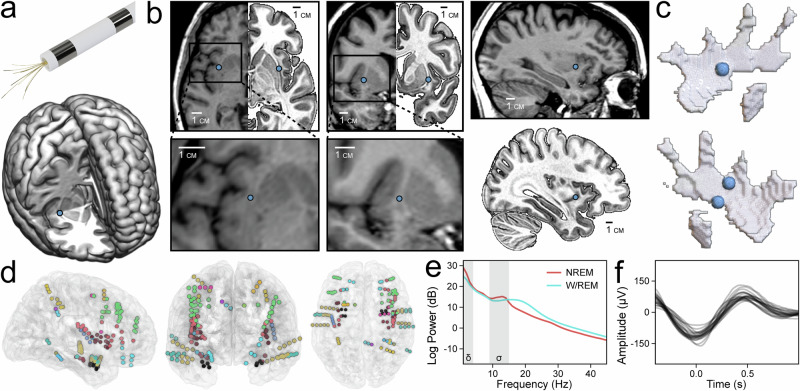
Fig. 1. Claustrum single units sampled with microwires.
a Model of a Behnke–Fried depth electrode with protruding microwires for sampling the claustrum (top). Location of right claustrum microwires (blue dot) in Subject A on the MNI152 template (bottom). b Axial, coronal, and sagittal T1 MR images of Subject A with corresponding mirrored MNI152 templates in the axial and coronal views (top row) marking the location of right claustrum microwires and accompanied by magnified inserts and a sagittal MNI152 template (bottom row). c Locations of distal microwires when superimposed onto MNI152 models of the right and left claustrum, respectively (left top and bottom). Sagittal T1 MR image of Subject A (top right) marking the location of the right claustrum microwires. d Electrode locations for all subjects superimposed onto the N27 template in axial, coronal, and sagittal views (left, middle, right). e Power spectral density of NREM and W/REM sleep across all channels in Subject B, Night 03. Delta and sigma frequency bands (indicating SWA and sleep spindles, respectively) are shaded. f Average waveforms of detected slow waves in each channel of Subject B, Night 03.

