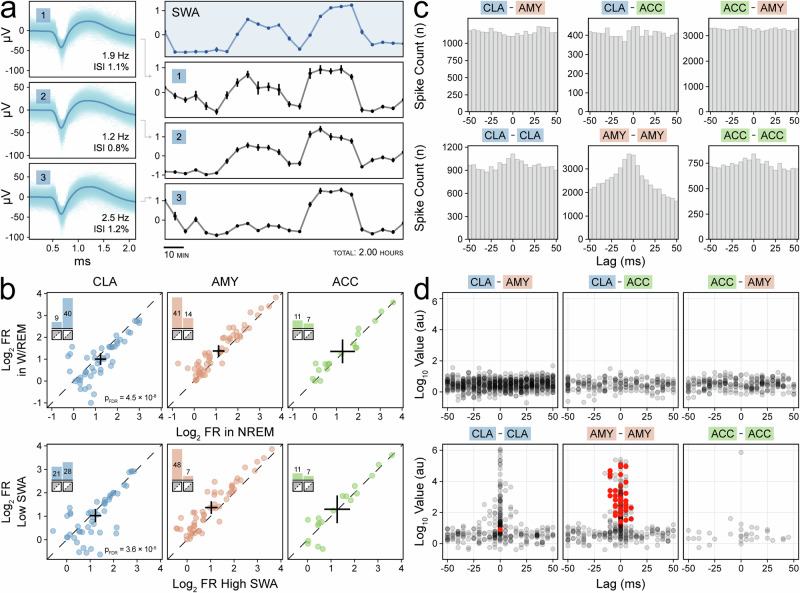
Fig. 3. Claustrum single units increase spiking with slow-wave activity (SWA) and non-rapid-eye-movement (NREM) sleep.
a Average waveforms of three claustrum units with inset firing rate and inter-spike interval violations (left panels) with corresponding mean z-scored firing rate (black panels) aligned to the illustrative z-scored slow-wave activity (SWA) in the right orbitofrontal cortex from Subject A (blue panels) (right panels). Standard error for each 5-min interval (30 epochs of 10 s each) is indicated by vertical bars. b Scatterplots of log2 firing rate of claustrum (blue), amygdala (orange), and anterior cingulate (green) units stratified by sleep stage (not NREM sleep vs. NREM sleep, left) and SWA (25th vs. 75th percentiles, middle). Crosses indicate population averages with 95% confidence intervals. Units in the lower triangle favor SWs. Inset bar plots indicate the number of units in the upper and lower triangles, and their sum indicates the sample size. c Example cross-correlograms during NREM sleep between single unit pairs with p < 0.05 prior to FDR correction on threshold-free cluster enhancement (TFCE) permutation testing (except for ACC–ACC). d Scatterplots stratified by region pairs showing the maximum TFCE value of each unit pair’s cross-correlogram (in log10) and the time lag at which it occurred; red indicates unit pairs with p < 0.05 after FDR correction on TFCE permutation testing.

