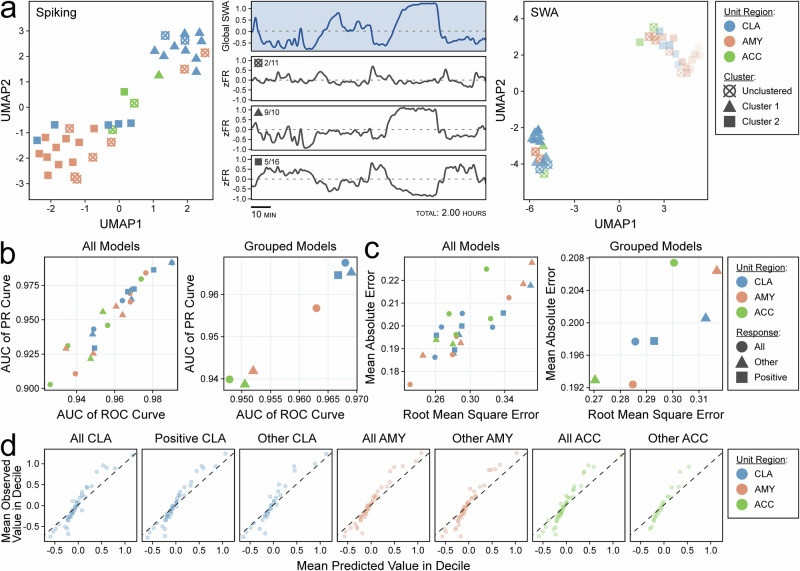
Fig. 5. Claustrum population activity predicts slow-wave activity (SWA).
a Scatterplot of UMAP dimensions for Subject A’s single-unit spiking activity demonstrating self-segregation of single units into two clusters (and one unclustered group) indicated by shapes (left). Global slow-wave activity (middle, top panel) with aligned z-scored population firing rates for UMAP clusters with fractions indicating the proportion of claustrum units in each cluster (middle). Scatterplot of two UMAP dimensions for the same units after dimensionality reduction of correlation with slow wave presence across channels (right). b Scatterplot displaying the area under the curve (AUC) for the receiver operating characteristic (ROC) curve and the precision-recall (PR) curve for support vector machine (SVM) models classifying sleep stage using dimensionally reduced population activity from single unit groups stratified by microwire region, response type, and sleep recording (left panel). The same results are shown after averaging across sleep recordings (right panel). Colors indicate unit region, and shapes indicate unit response type. c Scatterplot displaying the root mean square error (RMSE) and mean absolute error (MAE) of SVM models regressing global SWA using dimensionally reduced population activity from single unit groups stratified by microwire region, response type, and sleep recording (left panel). The same results are shown after averaging across sleep recordings (right panel). Colors indicate unit region, and shapes indicate unit response type. d Decile-wise calibration plots for the models in (c) stratified by response type and unit region. Values are arbitrary units (z-scored log10 of global SWA power). Colors indicate unit region.

