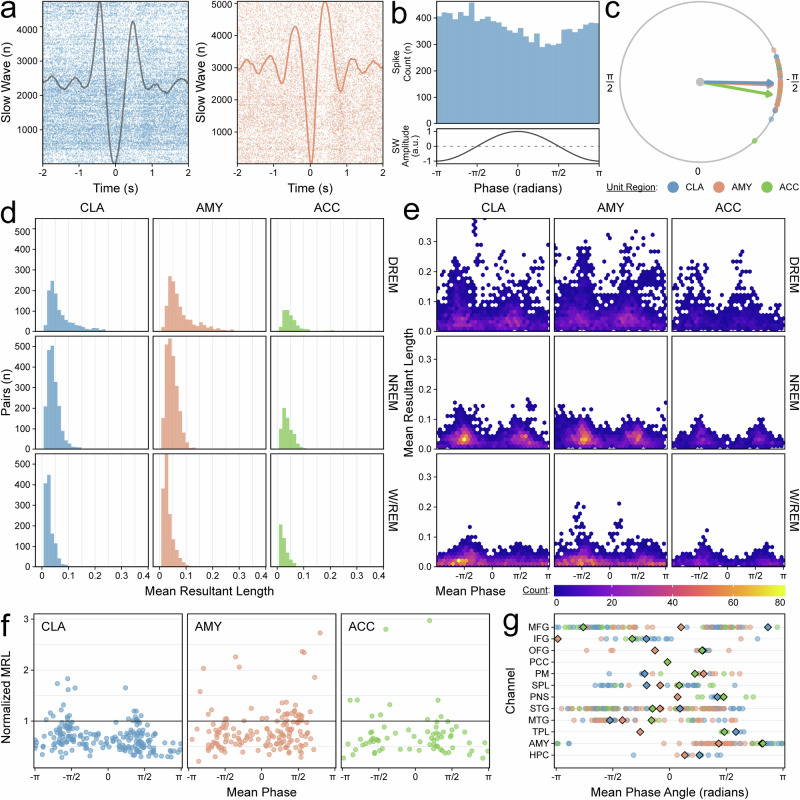
Fig. 6. Claustrum single units phase-lock with the slow-wave band.
a Raster plot demonstrating phase-locking of a claustrum unit with slow waves (SW) in an illustrative orbitofrontal channel (top) compared to phase-locking in an amygdala unit with its adjacent amygdala channel (bottom) in Subject B, Night 03. The average slow-wave waveforms are superimposed. b Phase histogram for the same claustrum-orbitofrontal pair (top); the amplitude of an idealized slow wave for each phase is shown (bottom). c Polar plot for the same claustrum-orbitofrontal pair indicating the preferred phase angle for every unit-orbitofrontal pair with a phase distribution significantly different from uniform. Color indicates unit region, and arrows indicate the average preferred phase angle among all pairs of the same unit region. d Histograms of mean resultant lengths (MRLs) for unit-channel pairs stratified by unit region and sleep stage. High delta NREM (DREM) indicates NREM sleep ≥75th percentile of NREM SWA power. Colors indicate unit region. e Heatmaps of the phases at which MRLs occurred for each unit-channel pair, stratified by unit region and sleep stage. f Scatterplot of phases at which MRLs occurred during DREM sleep. Only pairs with a significant relationship in DREM sleep but not in WREM sleep are displayed. The MRLs have been normalized to the mean MRL of AMY-AMY pairs, which is indicated by the horizontal black line. Colors indicate unit region. g Region-wise preferred phase angles for all unit-channel pairs with a phase distribution significantly different from uniform in DREM sleep but not W/REM sleep (combined across all subjects). Colors indicate unit region. Diamonds indicate the average preferred phase angles for each unit region. See Supplementary Table 5 for abbreviations.

