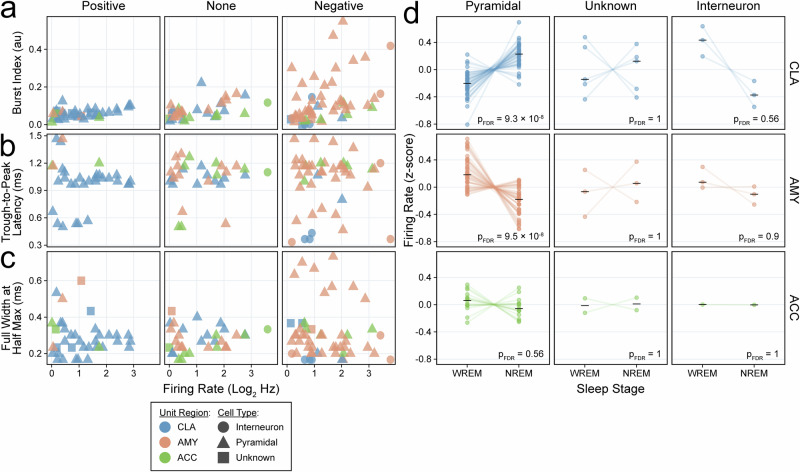
Fig. 7. Claustrum units that increase spiking with slow-wave activity are enriched with pyramidal cells.
a–c Scatterplots of firing rate (log2, Hz) versus a burst index (au), b trough-to-peak latency (negative-spiking units only, ms), and c full-width at half-maximum (ms) stratified by unit response type. Colors indicate unit region and shapes indicate cell type classification. d Paired dot plots of z-scored firing rates for units in WREM versus NREM sleep stratified by cell type classification and unit region; black horizontal lines indicate group medians, and p-values are derived from FDR-corrected Wilcoxon signed-rank tests (two-sided). Colors indicate unit region.

