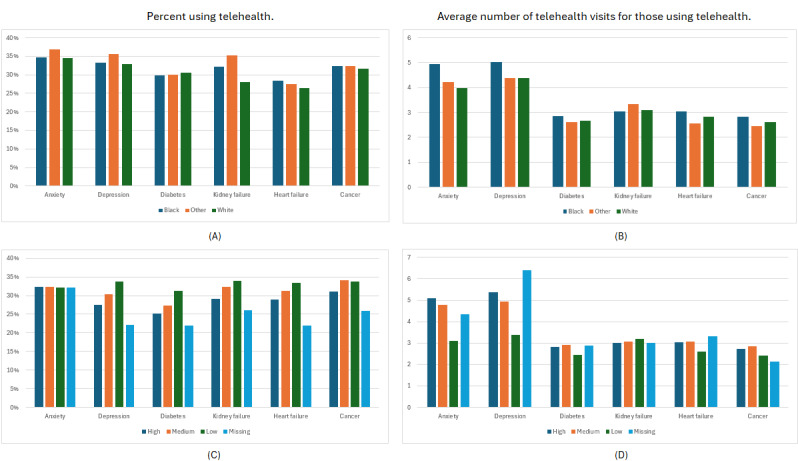
Figure 2.

The percentage of patients who have at least 1 telehealth visit (A) and the average number of telehealth visits for patients with at least 1 visit (B), during the 12-month pandemic period broken down by race; the percentage of patients who have at least 1 telehealth visit (C), and the average number of telehealth visits for patients with at least 1 visit (D) during the 12-month pandemic period, broken down by Social Vulnerability Index group.
