Table 2.
Absorption spectra of the studied molecules calculated with the CC2/aug-cc-pVDZ method at the geometry optimized at the MP2/cc-pVDZ theory level.
| S0 form | ΔEVE[eV] | λabs[nm] | f | µe[D] | |
|---|---|---|---|---|---|
| Molecule 1, H-bonded isomer | |||||
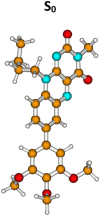
|
S0 | 0.00a | µg = 6.5 | ||
| S0→S1(π,π*) | 2.76 | 450 | 0.2071 | 10.1 | |
| S0→S2(n,π*) | 3.38 | 367 | 0.0010 | 1.6 | |
| S0→S3(n,π*) | 3.45 | 360 | 0.0013 | 3.1 | |
| S0→S4(π,π*) | 3.77 | 329 | 0.0146 | 21.9 | |
| S0→S5(π,π*) | 4.00 | 310 | 0.0432 | 1.7 | |
| S0→S6(π,π*) | 4.06 | 306 | 0.0269 | 21.6 | |
| Molecule 1, non-H-bonded isomer | |||||
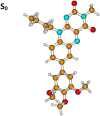
|
S0 | 0.026a | µg = 7.0 | ||
| S0→S1(π,π*) | 2.89 | 429 | 0.2308 | 9.3 | |
| S0→S2(n,π*) | 3.37 | 368 | 0.0007 | 3.4 | |
| S0→S3(n,π*) | 3.53 | 352 | 0.0012 | 3.7 | |
| S0→S4(π,π*) | 3.94 | 315 | 0.0104 | 19.3 | |
| S0→S5(π,π*) | 4.05 | 306 | 0.0380 | 1.6 | |
| S0→S6(n,π*) | 4.16 | 298 | 0.0004 | 3.9 | |
| Molecule 2 | |||||
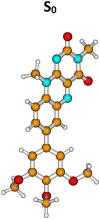
|
S0 | 0.0a | µg = 7.2 | ||
| S0→S1(π,π*) | 2.77 | 448 | 0.2305 | 10.5 | |
| S0→S2(n,π*) | 3.30 | 376 | 0.0003 | 3.2 | |
| S0→S3(n,π*) | 3.46 | 359 | 0.0006 | 3.8 | |
| S0→S4(π,π*) | 3.75 | 331 | 0.0151 | 22.1 | |
| S0→S5(π,π*) | 3.94 | 315 | 0.0583 | 1.8 | |
| S0→S6(π,π*) | 4.06 | 306 | 0.0371 | 20.2 | |
| Molecule 3 | |||||
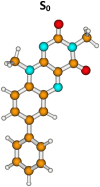
|
S0 | 0.0a | µg = 8.3 | ||
| S0→S1(π,π*) | 2.83 | 439 | 0.2298 | 9.6 | |
| S0→S2(n,π*) | 3.30 | 376 | 0.0003 | 2.3 | |
| S0→S3(n,π*) | 3.46 | 359 | 0.0006 | 4.7 | |
| S0→S4(π,π*) | 3.93 | 316 | 0.0390 | 2.7 | |
| S0→S5(π,π*) | 4.05 | 306 | 0.0855 | 13.3 | |
| S0→S6(n,π*) | 4.08 | 304 | 0.0001 | 3.9 | |
| Molecule 4 | |||||
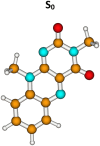
|
S0 | 0.0 | µg = 7.9 | ||
| S0→S1(π,π*) | 3.01 | 412 | 0.2138 | 7.9 | |
| S0→S2(n,π*) | 3.39 | 366 | 0.0004 | 1.5 | |
| S0→S3(n,π*) | 3.51 | 354 | 0.0005 | 4.4 | |
| S0→S4(π,π*) | 4.02 | 309 | 0.0955 | 2.9 | |
| S0→S5(n,π*) | 4.19 | 296 | 0.0000 | 4.7 | |
| S0→S6(π,π*) | 4.22 | 294 | 0.0723 | 11.4 | |
