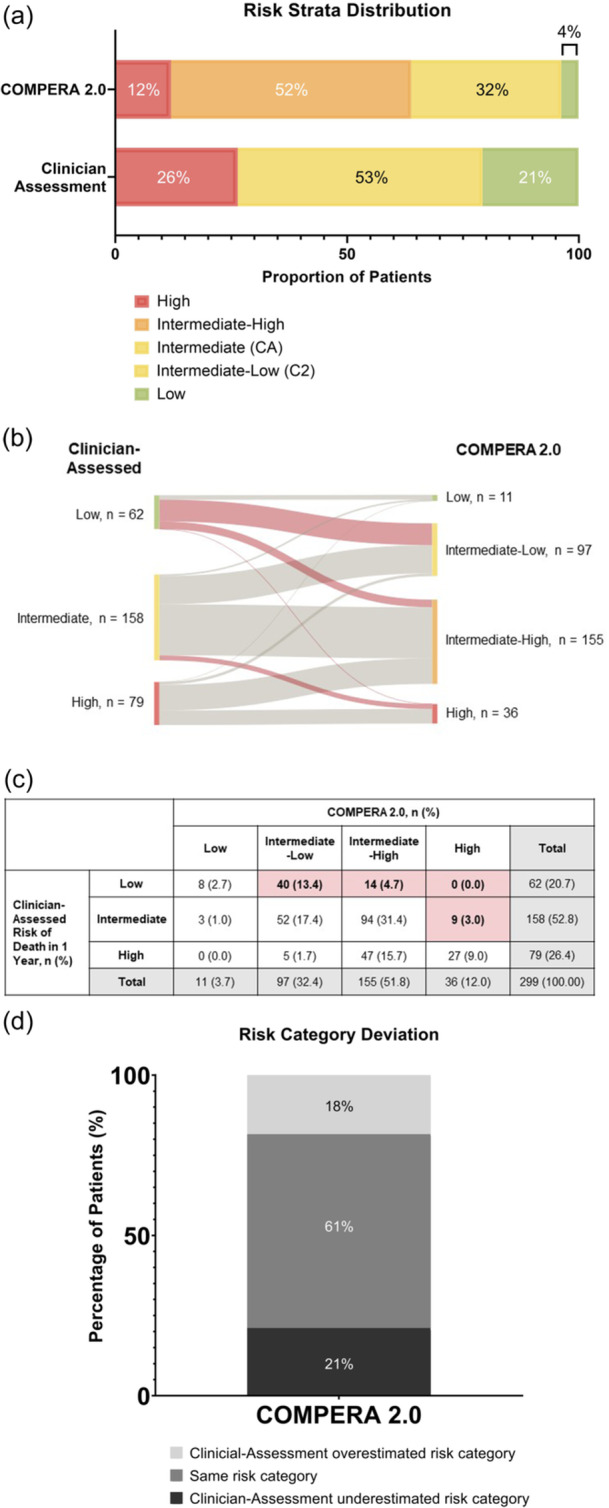
Figure 4.

Risk strata using COMPERA 2.0 versus clinician assessment in total study population (N = 299). (a) The majority of patients were categorized as intermediate risk by clinician assessment. The majority of patients were categorized as intermediate‐high or high risk by COMPERA 2.0. (b, c) Red shaded lines and boxes show patients whose risk level was underestimated by clinicians, relative to that calculated by COMPERA 2.0. Risk was underestimated most commonly in clinician‐assessed low patients. (d) Risk assessments between clinician gestalt and COMPERA 2.0 were incongruent at baseline (40%). Numbers may not add to 100% due to rounding.
