Figure 1.

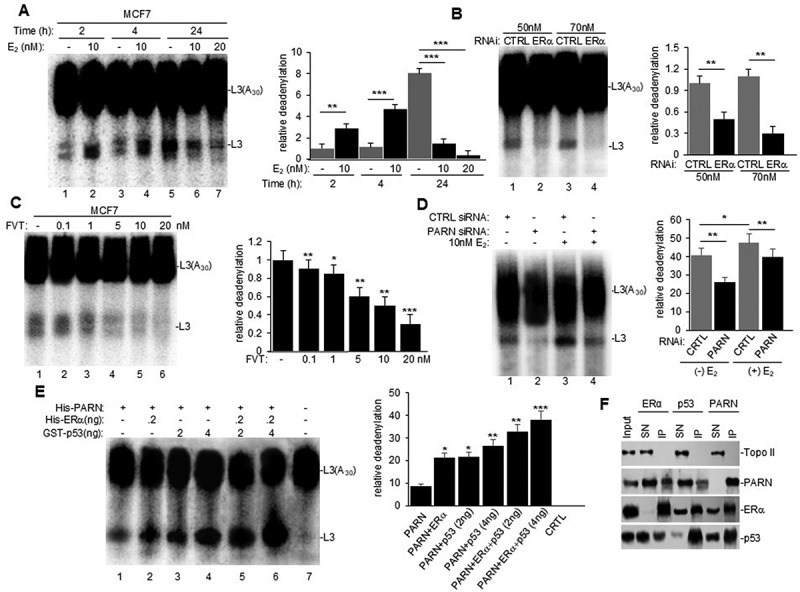
Estrogen receptor alpha (ERα) is an activator of PARN-mediated nuclear deadenylation in MCF7 (ERα+) cells. (A) nuclear extracts (NEs) for cells treated with different concentrations of 17β-estradiol (E2) for the indicated times were used in in vitro deadenylation assays with radiolabeled capped L3(A30) RNA substrate. Purified RNA was analysed by denaturing PAGE. Left panel: representative deadenylation reactions from three independent biological assays are shown. Positions of the polyadenylated RNA L3(A30) and the L3 deadenylated product are indicated. Right panel: bar graph of relative deadenylation (RD) is shown. (B–C) in vitro deadenylation assays using NEs from cells treated with (B) control (CTRL) or ERα siRNA for 24 h or (C) with increasing concentrations of fulvestrant for 2 h (FVT) were performed and analysed as in (A). (D) MCF7 cells were treated with either CTRL or PARN siRNA and subsequently treated with vehicle or E2. NEs were used for in vitro deadenylation as performed and analysed in (A). E) Cell-free deadenylation assays were performed in the presence of radiolabeled capped L3(A30) RNA substrates, limiting amount of his-PARN deadenylase and his-ERα and increasing amounts of GST-p53. Conditions for deadenylation assays were performed as in (A). F) NEs from untreated cells were used in endogenous reciprocal co-immunoprecipitation (e-ip) assays with polyclonal ERα, PARN, or p53 antibodies. NEs were treated with RNase A. Equivalent amounts of pellets (IP) and supernatants (SN) were resolved by SDS-PAGE, and proteins were detected by Western blot. Topo II was used as loading and IP specificity control. Ten percent of the NEs used in the e-ip assays are shown as input. All figures show representative deadenylation reactions and Western blot analyses from at least three independent biological assays analysed by triplicate (n = 3). Experiments with two groups were analysed using two-tailed unpaired Student’s t-test. The p-values are indicated as *(<0.01), **(<0.001) and ***(<0.0001).
