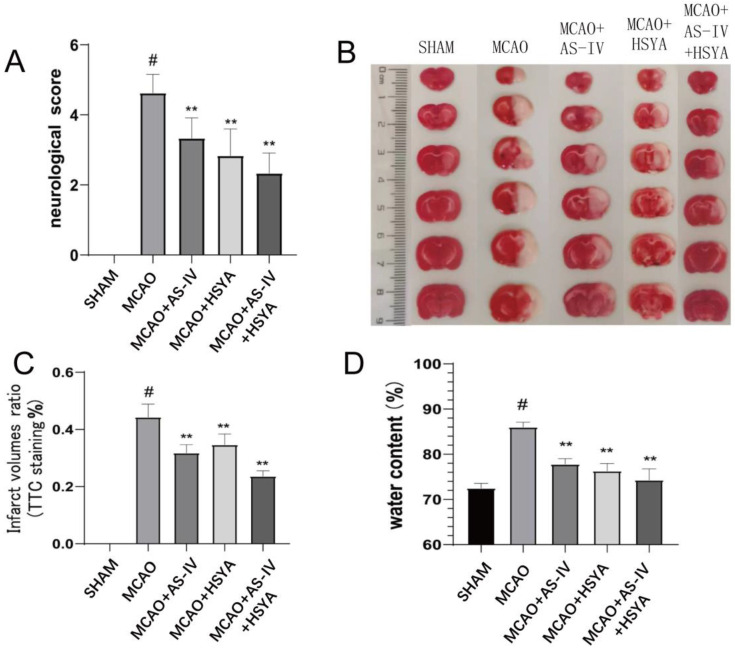
Figure 2.
Effects of AS-IV, HSYA, and their combination on nerve function, cerebral infarction, and cerebral edema. (A) Neurological function deficit scores on the third day after reperfusion. Data are presented as mean ± standard deviation (n = 6). (B) TTC staining of representative cerebral infarction on the coronal plane of the brain. (C) The infarct ratios were calculated from the TTC staining images. Data are presented as mean ± standard deviation (n = 6). (D) The brain water content represents cerebral edema. Data are presented as mean ± standard deviation (n = 6). ** compared with the MCAO group (p < 0.01), # compared with the Sham group (p < 0.01).

