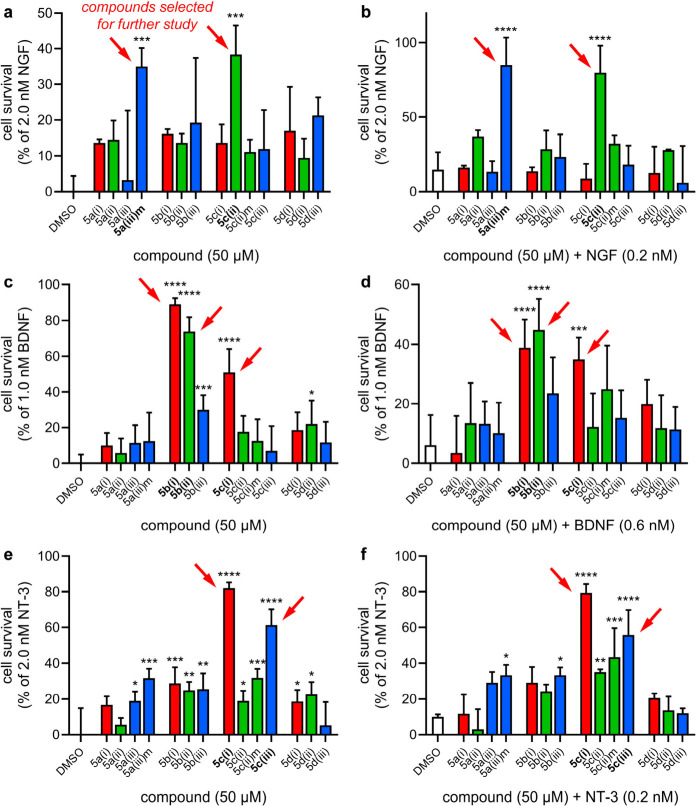
Figure 2.
Mimic-induced cell survival of TrkA-expressing cells (a and b), B-expressing cells (c and d), or C-expressing cells (e and f) in the absence of NT (“-NT”, a, c, e) or in the presence of suboptimal NT (“+NT”, b, d, f). Cells were incubated in serum-free media with compound and/or neurotrophin for 48–72 h; then, viability was assessed via flow cytometry. Data is represented as mean ± SD where n = 3. Data was analyzed via one-way ANOVA followed by Dunnett’s t test compared to the DMSO control where *p < 0.05, **p < 0.01, ***p < 0.001, and ****p < 0.0001.

