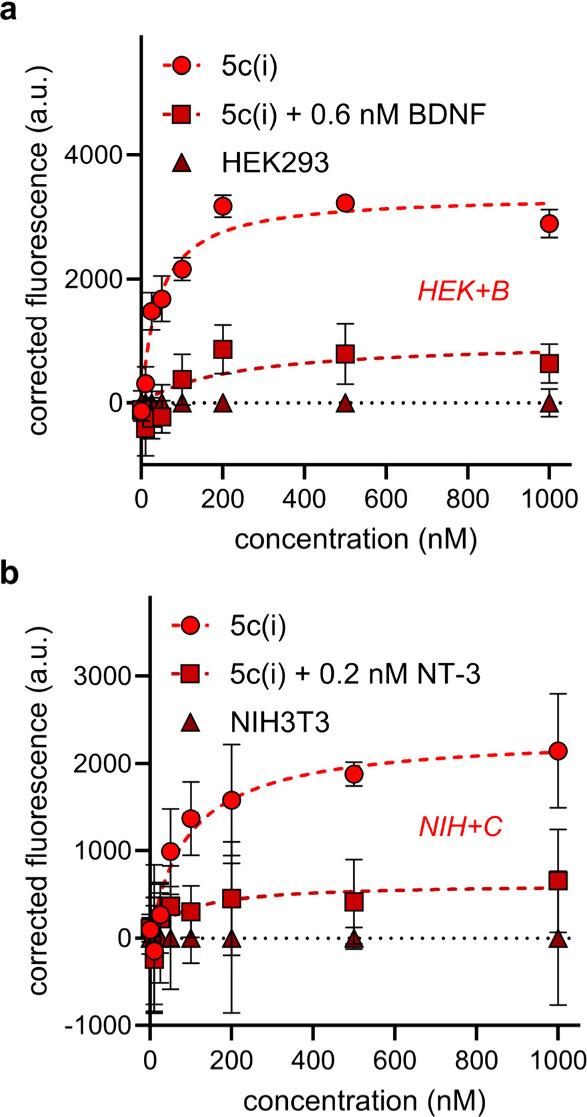
Figure 5.

Cell-surface fluorescence binding experiments for 5c(i) to (a) HEK-TrkB and (b) NIH-TrkC. Data are represented as mean ± SD where n = 3 and are representative of three independent experiments. Corrected fluorescence means were obtained by subtracting the background fluorescence of compound binding to the wild-type cell line and SD by propagation of error. Kd’s were calculated using the nonlinear regression “One site – specific binding” analysis in GraphPad Prism 10.2.
