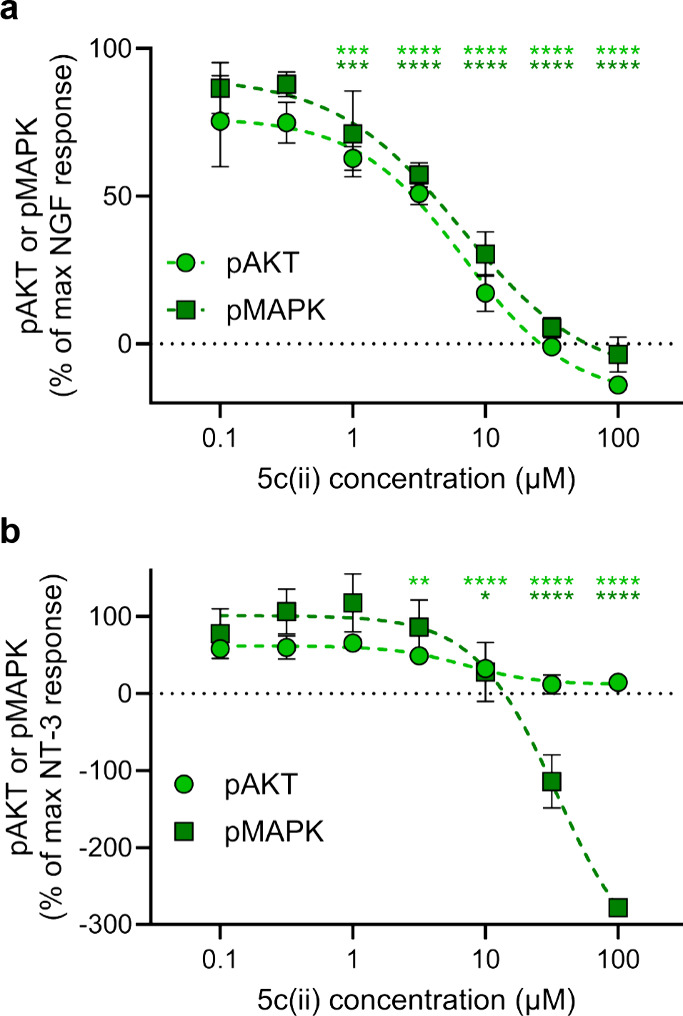
Figure 6.

ELFI for 5c(ii) competing against NT (10 ng/mL) for downstream signaling in (a) PC12 cells and (b) NIH+C. Data are represented as mean ± SD where n = 3 and are representative of three independent experiments. Data is analyzed via two-way ANOVA followed by Dunnett’s t test compared to 10 ng/mL NT control. Significance is denoted as *p < 0.05, **p < 0.01, ***p < 0.001, and ****p < 0.0001.
