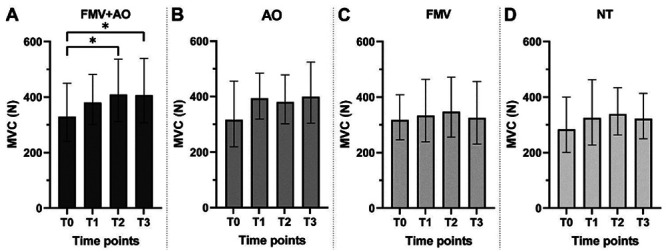
Figure 3.

MVC barplots for each condition. Data presented as geometric mean±SDf. To compare difference between timepoints within a condition we used the Repeated Measures one-way ANOVA test with Geisser-Greenhouse correction, with Tukey multiple comparison test with individual variances computed for each comparison on data converted to the logarithmic domain (see Materials and Methods). *p<0.05.
