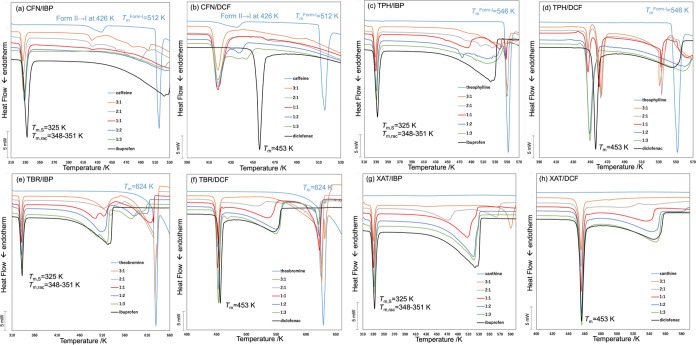
Figure 4.
DSC curves of the CFN/IBP (a), CFN/DCF (b), TPH/IBP (c), TPH/DCF (d), TBR/IBP (e), TBR/DCF (f), XAT/IBP (g), and XAT/DCF (h) mixtures at various molar ratios. Pure XAT derivatives (sky blue), pure APIs (black), and their mixtures at ratios of 3:1 (orange), 2:1 (gray), 1:1 (red), 1:2 (blue), and 1:3 (green). IBP produced an endothermal signal at 52 °C, indicating the sample was an enantiomer (a, c, e, g). Polymorphs of CFN anhydrous crystals contained Form I (melting point = 237 °C) and Form II (phase transform to Form I at 160 °C for intact crystals and at 153 °C for ground powder) (a, b). Polymorphs of TPH anhydrate crystals contained Form I (melting point = 273 °C) and Form II (melting point = 269 °C) (c, d). The Tm of the pure TBR was 315 °C (e, f), whereas the pure XAT was not verified under these experimental conditions (g, h). Shifts were not observed in the endothermic signals of IBP (e, g) and DCF (h) in the mixtures at these molar ratios; however, nonzero shifts were observed in the DCF mixtures of pure DCF (f).

