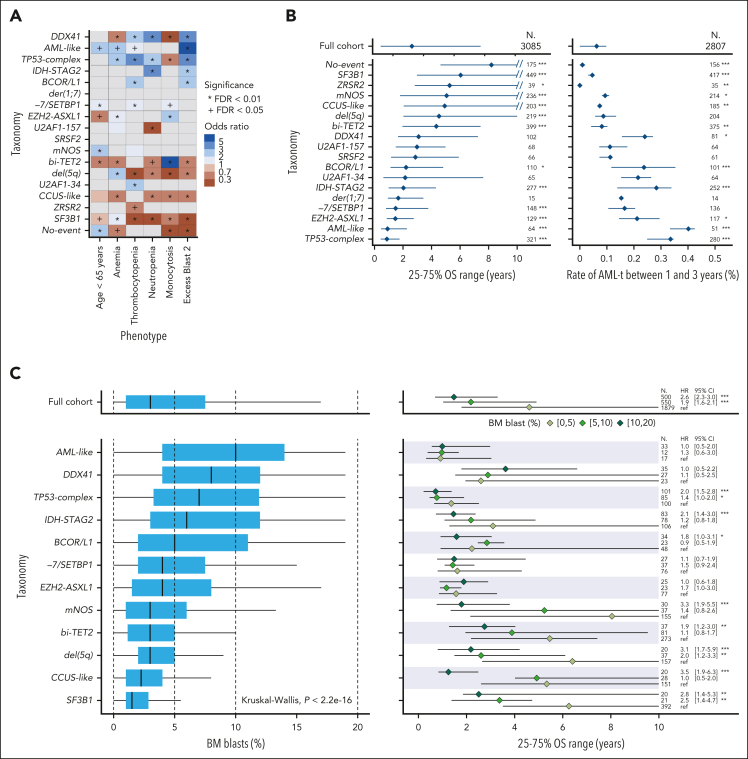
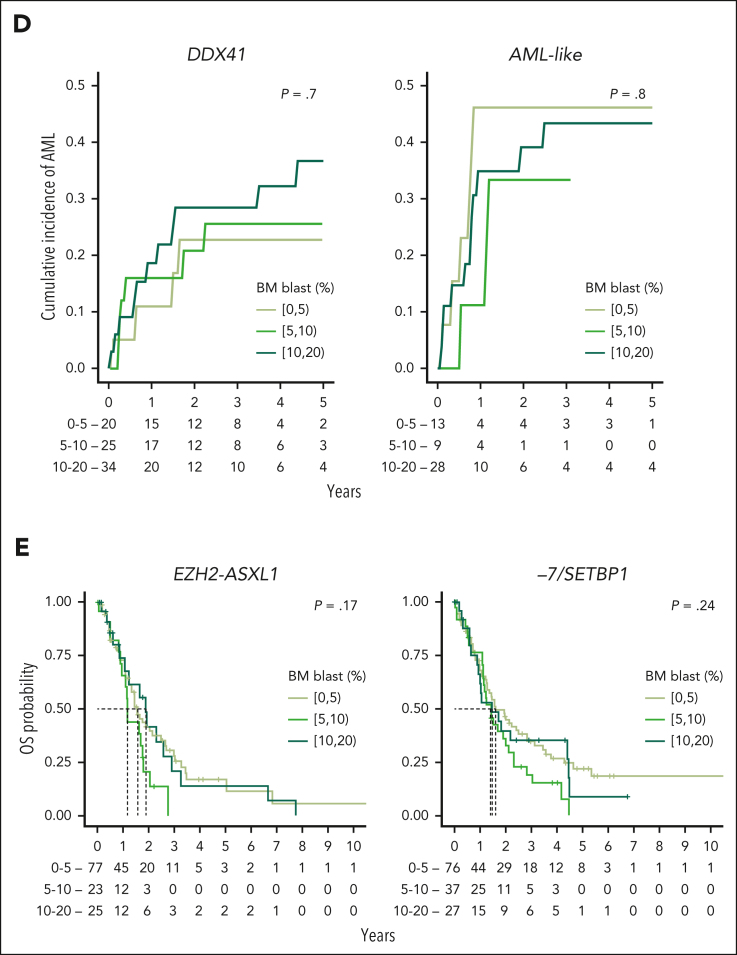
Figure 4.
Associations between MDS molecular groups, clinical phenotypes, and outcomes. (A) Association between molecular groups and clinical phenotypes. Darker blue indicates co-occurrence, and darker red indicates mutual exclusivity. (B) Association between molecular groups and outcomes, for OS (left) and AML transformation (AML-t, right). Dots indicate median OS and lines extend to the interquartile range (left). Dots indicate the 2-year incidence of AML-t and lines extend to the 1-year and 3-year incidences (right). The outcome metrics on the full cohort are provided on top for comparison. P values are from the log-rank test (OS) and the Gray test (AML-t). ∗∗∗P < .001; ∗∗P < .01; ∗P < .05. (C) Distribution of the percentage of BM blast for 12 molecular groups with at least 10 patients within each subset of BM blast, that is, 0% to 5%, 5% to 10%, and 10% to 20% (left). Median survival (dots) and interquartile range (lines) for each blast subset within each molecular group (right). P values are from a univariate Cox model with the 0% to 5% blast subset used as the reference level. The distributions of the full cohort are provided on top for comparison. (D) Cumulative incidence curves of AML-t stratified with the range of percentage of BM blast within the DDX41 and AML-like subgroups. P values are from the Gray test. (E) Kaplan-Meier probability estimates of OS stratified with the range of percentage of BM blast within the EZH2-ASXL1 and −7/SETBP1 subgroups. P values are from the log-rank test. CI, confidence interval; HR, hazard ratio; ref, reference level.


